Updated: May 28, 2026
Every dollar your organization spends holds the power to transform your business. Behind every transaction lies insight, and behind every insight, opportunity. It is the essence of spend analysis, a process that helps you understand where that money goes, what it's doing for you, and where it could be doing more.
In this guide, we will walk you through the secrets of the successful spend analysis process and reveal why spend data has become the ultimate game-changer for businesses of all sizes.
Advancements in automation and AI are accelerating this shift. Leaders no longer have to wait for reports. They can access real-time insights into supplier performance, compliance, category-level trends, and emerging risks. When implemented effectively, spend analysis informs not only procurement decisions but also budgeting, forecasting, and ESG initiatives.
Why keep reading? Because spend isn't just a procurement concern — it's a reflection of your organization's financial DNA. In many businesses, external spend accounts for 60-80% of total revenue. That means your ability to understand, manage, and act on spend data directly influences profitability and competitiveness.
Are you ready to unlock the potential of your spend data? Let's dive in and set you on the path to greatness!
Introduction to Spend Analysis
Spend analysis is the process of evaluating an organization's expenditure data to understand spending patterns, identify cost-saving opportunities, improve efficiency, and optimize procurement strategies. Spend analysis aims to answer questions:
- What are we buying?
- How much have we paid?
- How much have we bought?
- Whom are we buying from?
- Who is buying?
- On what terms?
By analyzing products, prices, quantities, suppliers, business units, and payment terms, spend analysis provides a holistic understanding of spending patterns and supplier performance. More recently, procurement leaders are increasingly focused on impact and agility, asking questions such as:
- How can we make better decisions?
- How do we make decisions faster?
- How can we scale results and focus on strategy?

Key terms and definitions relating to Spend Analysis
To get started, here are the key terms you need to know when working with spend data.
Spend data (also known as procurement spend data) is information dealing with a company's expenditures on goods and services purchased from external suppliers.
Spend data management is the process of collecting, sorting, and managing that spend data.
Spend analysis is the process of collecting, cleaning, classifying, and analyzing procurement data to gain visibility, identify savings opportunities, and improve decision-making. It often includes the broader application of advanced data analytics techniques to expenditure data — commonly referred to as Spend Analytics — such as AI and predictive modeling, which enhance insights and help forecast trends, assess risk, and drive more strategic actions.
AI-powered spend analytics refers to the use of artificial intelligence to enhance the traditional process of analyzing procurement data. Unlike conventional methods that rely on manual classification and static reports, AI-driven approaches continuously learn from data to identify patterns, understand trends, and support real-time decision-making.
Importance of Spend Analysis
Spend analysis is a key component of effective financial management and procurement strategy building. This process helps procurement identify areas for improvement and uncover potential savings by consolidating suppliers, negotiating better terms, and eliminating unnecessary expenses. Organizations that implement intelligent spend analysis achieve a reduction of up to 90% in time spent on manual data preparation and analysis, enabling teams to focus on strategic activities rather than repetitive tasks.
This process also accelerates the identification of savings opportunities, typically 3 to 5 times faster than traditional methods, and can lead to a 15–25% improvement in negotiation results when supported by real-time benchmarking.
Additionally, spend analysis enhances transparency and accountability, ensuring that all expenditures align with the company's strategic objectives and compliance requirements.
As AI-based tools continue to learn from historical and current data, they help improve the relevance of recommendations over time, supporting the continuous refinement of procurement strategies.
Spend analysis benefits
Spend analysis offers procurement organizations several key benefits. Independent research has shown that organizations leveraging advanced procurement analytics have achieved up to a 63x return on investment, driven by both direct savings and internal efficiency gains.
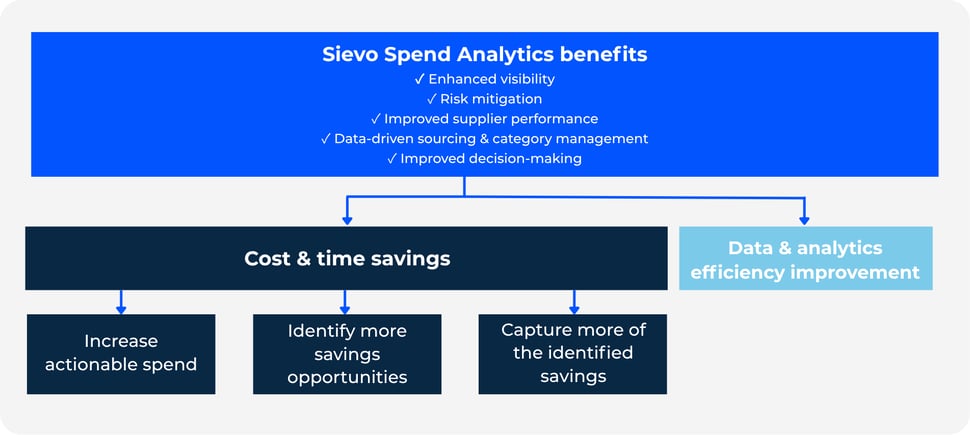
Here's an overview of some of the top benefits of spend analysis:
Cost reduction
Spend analysis helps you meet your cost reduction goals and track incremental savings initiatives. Uncover inefficiencies and eliminate unnecessary expenses to achieve substantial cost savings. Improved visibility helps identify cost-saving opportunities. You can benchmark your suppliers, manage your tail spend, identify maverick buying behavior, and ensure contract compliance.
With AI surfacing savings opportunities, even from fragmented or inconsistent data, teams can move faster and reduce cycle times for capturing value in real-time. Smarter platforms dig into material-level duplication, surface payment term gaps, and suggest supplier negotiation angles you might've missed, turning overlooked details into real savings.
Enhanced visibility
Spend analysis provides better visibility and actionable intelligence. Gain a comprehensive understanding of spending patterns, leading to better financial planning and control. It provides a comprehensive view of the metrics that drive improved cost savings, process efficiency, and supply chain performance.
Spend visibility extends beyond tracking spending, as it provides both a detailed and holistic view of how money is flowing through your company. AI can now enhance this by aggregating and standardizing data from multiple ERPs and systems, enabling an up-to-date view of spend across categories, regions, and suppliers. Integrated benchmarks bring in external context, so you can understand what it means, how it compares, and where to focus next.
Time saving
By centralizing and organizing spend data, spend analysis minimizes the administrative workload associated with tracking and managing spend. AI now automates much of the manual work, including data cleansing, classification, and categorization, significantly reducing the time it takes to transform raw data into actionable insights.
By systematically analyzing spend data, organizations can quickly identify opportunities for reducing spend and improving sourcing, rather than spending extensive time manually reviewing data to uncover these opportunities. Advanced tools provide teams with access to self-service analytics and built-in automations, enabling them to act immediately without relying on technical or IT support.
Risk mitigation
Spend analysis allows you to identify potential risks and ensure compliance with procurement policies and regulations. Analysis will enable you to track and identify non-contracted spend and vendors. Adding suppliers' credit scores and ESG information to spend data allows for a more accurate assessment of overall supply chain risk.
AI can continuously monitor for outliers, unusual patterns, and shifts in supplier behavior, flagging potential risks in real time and enabling earlier intervention. Some spend analytics software also provides supplier collaboration insights and simulates supplier impact to help prioritize development efforts based on strategic value.
Improved supplier performance
By analyzing spend data, organizations can evaluate supplier performance based on factors such as delivery times, quality of goods or services, and compliance with contract terms. This comprehensive evaluation helps identify top-performing suppliers and those that may require improvement. AI makes it easier to detect trends early and take action before small issues escalate into larger ones. Built-in scoring, segmentation, and supplier impact analysis help prioritize which relationships to invest in, develop, or replace.
Data-driven sourcing & category management
Spend analytics enables sourcing professionals to identify trends, market changes, performance issues, consolidation opportunities, and sourcing potential. Teams use it to identify new sourcing categories, segment suppliers, and narrow down key suppliers for development programs. Companies can consolidate purchases with high-performing suppliers, negotiate better terms, and reduce reliance on underperforming ones.
With AI-generated insights, sourcing strategies can be continuously refined and optimized based on live market and performance data. Embedded recommendations accelerate sourcing cycles, helping teams respond swiftly without lengthy analysis.
Improved decision-making
Spend analysis allows you to leverage data-driven insights to make strategic decisions that align with your organization's goals and procurement strategy. Benchmark your performance internally across business units, locations, and categories to identify areas for potential improvement.
Without timely data and a holistic view of your supply chain performance, it's impossible to make decisions that result in the best outcome for your business. AI agents, embedded recommendations, and one-click actions are improving how teams translate insights into decisions, supporting scale without additional overhead.
How to do Spend Analysis
Traditional spend analysis follows a core sequence: extract, cleanse, classify, and analyze spend data to uncover savings opportunities.
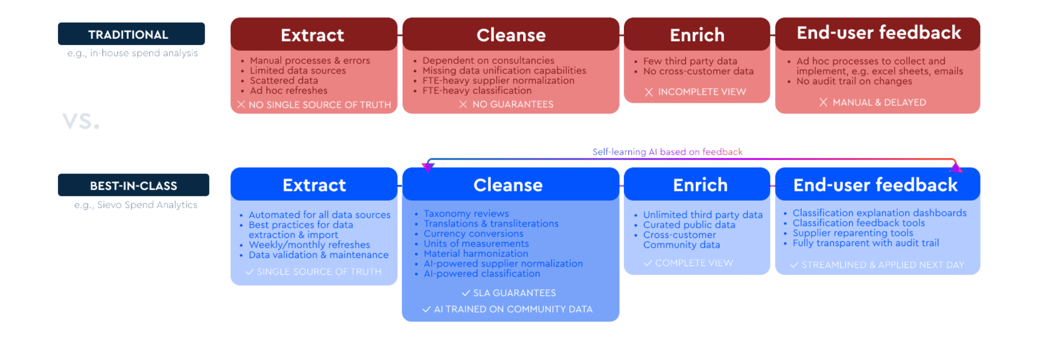
These steps are still relevant, but today's best-in-class analytics can take it a step further. They eliminate manual effort, connect to richer data sources, and generate actionable insights that have a direct impact on the bottom line.
1. Data Aggregation
Spend analysis starts with data, but not just any data. It needs to be complete, connected, and continually refreshed. That means pulling from all systems, across every region and business unit.
- Automated extraction from ERP, procurement platforms, and data lakes
- Real-time or scheduled refreshes, no manual uploads
- Structured and unstructured data unified in a single environment

2. AI-Powered Data Cleansing
Raw data is rarely analysis-ready. Cleansing used to be a manual grind of correcting typos, merging duplicate entries, and normalizing supplier names. Now, AI and machine learning handle this at scale.
- AI data classification, with expert verification and feedback mechanisms
- Supplier normalization and parenting using trained ML models
- Material harmonization to detect duplicate items across systems
- Automated translation, unit of measure conversion, and currency normalization
- Continuous improvement through user feedback loops that train the models over time
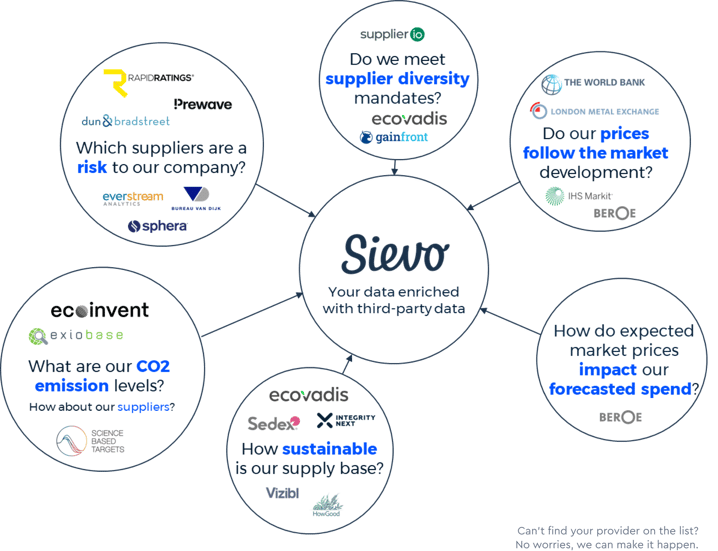
3. Data Enrichment
Once your data is clean, it needs context. That's where enrichment comes in, layering internal and external intelligence to make the data truly strategic.
- Transaction-validated benchmarking
- Curated public data sources, like AI-summarized supplier profiles, certifications, and sustainability goals (e.g., SBTi)
- Third-party data feeds for risk scores, market benchmarks, delivery reliability, ESG ratings, and more

4. Automated analytics and opportunity recommendation
Procurement teams once relied on digging through reports to find insights. Now, AI brings the insights to you.
- Impact quantification included with every recommendation
- Relevance tuned by user behavior and role-based preferences
- Out-of-the-box dashboards designed to drill down fast
- Automated identification of opportunities across:
- Cost savings
- Working capital improvements
- Risk mitigation
- Compliance and policy alignment
- Sustainability (e.g., Scope 3 emissions)
- Supplier base or process consolidation
5. Guided Actions
Identifying opportunities is only half the battle. The real value lies in executing them and doing so quickly, consistently, and at scale. That's where guided actions come in.
- AI-generated supplier communications, including negotiation emails, tailored to the opportunity context
- Direct integration with savings tracking systems to capture and measure initiatives without manual overhead
- Support for autonomous and semi-autonomous negotiations using AI agents
6. Conversational Analytics and Self-Service
Spend analysis has lived with analysts and power users. Modern platforms provide everyone, from procurement leads to finance partners, with the ability to engage directly with data and drive informed decisions.
-
- Natural language querying that allows users to ask questions in plain English
- Conversational interfaces that guide users through complex analysis
- Self-service capabilities that reduce dependence on technical specialists

Spend Analysis KPIs and metrics
Procurement data can be sliced and diced based on a number of key performance indicators (KPIs). Key Performance Indicators for spend analysis are essential metrics that help organizations measure the effectiveness of their procurement activities and identify areas for improvement.
Here are some crucial spend analysis KPIs to follow:
-
Spend Under Management: This KPI measures the percentage of total spend that is actively managed by the procurement team. High levels of spend under management indicate effective procurement practices and better control over expenditures.
-
Spend Visibility: This KPI assesses the extent to which an organization has a clear and comprehensive view of its spending data. High spend visibility enables better decision-making and spend management.
-
Cost Savings: This KPI tracks the total amount of money saved through cost reduction initiatives, such as supplier negotiations, strategic sourcing, and spend consolidation. It helps quantify the financial benefits of spend analysis.
-
Savings as a Percentage of Spend: This KPI measures the cost savings achieved as a proportion of total spend. It provides a clear indication of the efficiency and effectiveness of procurement strategies.
-
Spend by Category: This KPI breaks down spending into various categories, such as direct and indirect spend, to provide insights into where money is being allocated. It helps identify high-spend areas that may require closer scrutiny or optimization.
-
Supplier Consolidation: This KPI monitors the number of active suppliers and the concentration of spend among them. Effective supplier consolidation can lead to better pricing, stronger relationships, and simplified procurement management.
-
Supplier Performance: Metrics under this KPI include on-time delivery rates, order accuracy, and quality of goods or services. Monitoring supplier performance helps ensure that suppliers meet the organization's standards and contractual obligations.
-
Payment Terms Compliance: This KPI monitors adherence to agreed payment terms with suppliers. Timely payments help maintain good supplier relationships and can also leverage early payment discounts, contributing to overall cost savings.
-
Contract Compliance Rate: This KPI measures the percentage of spend that falls under negotiated contracts versus off-contract or maverick spend. High compliance or contract utilization rate indicate better procurement governance and cost management.
-
Procurement Cycle Time: This KPI tracks the average time taken to complete the procurement process from requisition to purchase order. Shorter cycle times reflect efficient procurement processes and quicker response to business needs.
Spend analytics solutions allow you to track KPIs in real-time through intuitive dashboards and custom reporting.
Spend Analysis Examples
There are countless opportunities and insights to discover in your spend data. Here are some of the most fundamental procurement analytics exercises you can use.
Automated Recommendations for Savings or Risk Mitigations
Automated recommendations are insights generated through large-scale analysis of procurement data. Instead of manually searching through reports or dashboards, the system continuously reviews patterns and highlights the most relevant opportunities for improvement.
These recommendations are typically generated by analyzing data across multiple systems: contracts, invoices, suppliers, and categories. Once surfaced, each recommendation is prioritized based on potential business impact.
This type of analysis is especially helpful when managing large, complex supplier networks or decentralized purchasing environments. It shifts the effort away from manually identifying where to act and allows procurement teams to focus on execution.
Automated recommendations can include:
- Opportunities to consolidate suppliers or renegotiate terms
- Alerts for compliance gaps or maverick spend
- Potential cost savings based on historical trends and pricing benchmarks
- Supplier risk indicators based on delivery, payment, or performance data
Conversational Spend Analytics
Conversational spend analytics allows users to interact with procurement data using natural language. Instead of navigating filters or building reports, users can ask questions in plain English and receive real-time answers.
This capability is handy for non-technical users who require prompt answers to inform their decision-making. Common use cases include budget reviews, supplier evaluations, category planning, and executive briefings.
A conversational interface connects directly to the underlying spend data and can respond to questions like:
- "Which suppliers had the most late deliveries last quarter?"
- "How much did we spend on marketing software in June?"
- "Which business units are exceeding their allocated budgets?"
Responses are returned as summaries, tables, or charts without requiring prior training or technical knowledge. Conversational spend analytics helps increase access to procurement insights across the organization.
Spend Cube
The spend cube is a way to look at spend data projected as a multidimensional cube. The three dimensions of the spend cube are suppliers, corporate business units, and categories. The dimensions could include subcategories of the different units across the organization.
The spend cube is typically the final output of a spend analysis process. It allows you to look at all of the analyzed data from a variety of angles. A spend cube is usually needed if a company is not managing the full percentage of expenditures across all business units.
The 3 axes represent Category (What you are buying), Cost Center (Who you are buying it for), and Supplier (Who are you buying it from). These are the three legs of the stool – if any one leg is not there, the entire model falls apart.
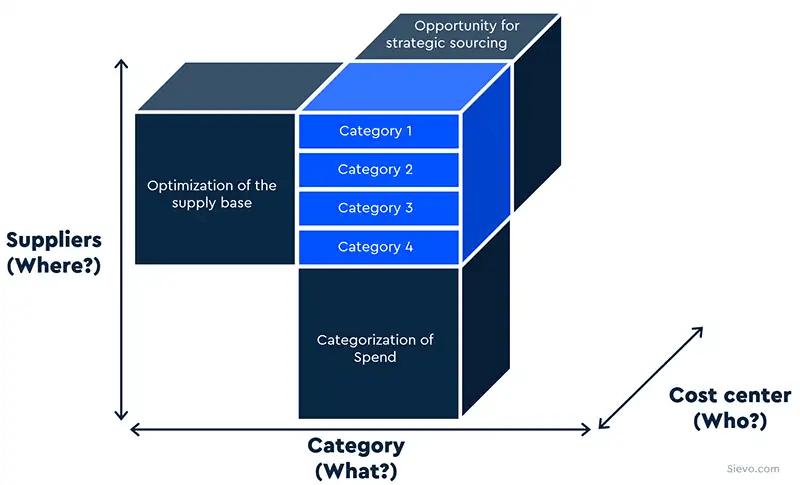
Each axis of this cube contributes critical information:
-
Category analysis tells what specific types of goods and services you buy.
-
Cost center analysis reveals which functions (or end-users) within your organization drive the demand.
-
Supplier analysis tells you which suppliers you’re buying from.
You can then assess if expenditures are scattered or cumulative, or if suppliers have simultaneous contracts with different units in the organization.
You can slice and dice data to analyze it from many different directions. This ensures that you have just one sourcing strategy and not hundreds. You can base your category strategies based on more insights.
ABC Analysis
ABC spend analysis, also known as ABC classification, is a method used to categorize inventory or spending based on their importance to the organization. This technique helps prioritize management efforts and allocate resources by focusing on the most critical items.
Here’s how it works:
- Category A: These are high-value items that account for a small percentage of the total number of items but a large percentage of the total spend (typically 70-80%). These items are critical and require close monitoring and management.
- Category B: These items have a moderate value, accounting for a larger percentage of items but a moderate percentage of the total spend (typically 15-20%). They require regular management but not as intensively as Category A items.
- Category C: These are low-value items that make up the majority of the total number of items but a small percentage of the total spend (typically 5-10%). These items require minimal management and control.
Supplier level spend analysis involves creating a detailed spend profile for each supplier using historical data. Supplier spend data gives enable year-on-year comparison and analysis for data-driven decisions.
Tail Spend Analysis
Tail spend is defined as the amount of money that an organization spends on purchases that make up majority of transactions but only a friction of total spend volume. In ABC analysis these fall into the category C.
Tail spend is generally considered low-value purchasing, as it makes up only a small portion of spend (usually 10% of each spend category). Tail spend is easy to ignore but it's often the area where organizations may be leaving money on the table and utilizing their resources inefficiently.
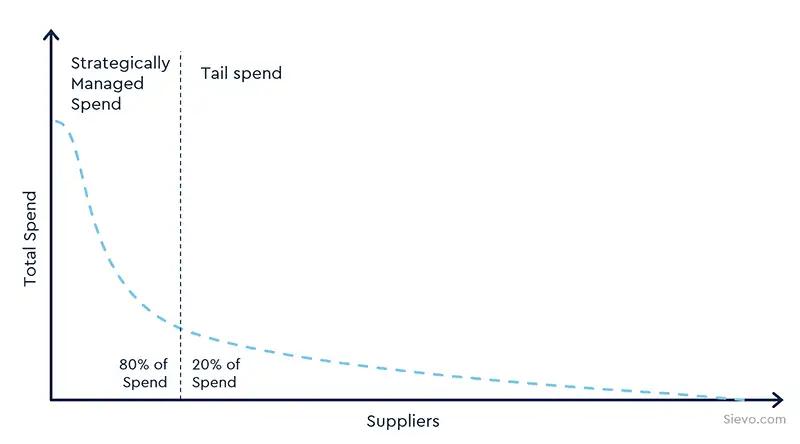
The figure above illustrates the simplest approach to analyzing a company’s tail spend: calculating the spend ratios to suppliers at various points along the purchasing range. Here, the Y-Axis represents spend per supplier ("Total Spend by Supplier"), and the X-Axis represents the total supplier base ("Supplier"). Suppliers are ranked in descending order.
Tail-end spend management has been growing in recognition and increasing importance within procurement. Tail spend analysis can yield potential savings, reduce costs, improve key supplier relationships, and increase spend under management.
There are usually many low-value transactions with multiple vendors across business units. To combat this, you can identify contract leakages and maverick spending. The aim of tail spend management is reducing number of suppliers and consolidation of spend to preferred or key suppliers.
Category Spend Analysis
Category spend analysis allows you to explore spend in a defined spend category hierarchy. This is useful in identifying spend leakage issues.
The first step in doing a category spend analysis is understanding the scope and breadth of the category. Are you buying similar goods and services from too many different vendors? This analysis is built on hierarchies, and the spend transactions are categorized into the most appropriate category.
Allocating spend consistently into categories makes the data easier to navigate, interpret, and understand. When organizations can focus on prioritizing their top spend categories, it helps them identify and forecast savings opportunities.
Prioritization will allow better negotiations for key spend categories to ensure more favorable contracts and pricing. By drilling into their spend data, procurement professionals are also gaining a deeper understanding of their spend categories.
When you have a high-level overview of spend by category, it is easier to identify categories that help deliver savings and realize which projects bring strategic importance to the organization. With this, you can easily figure out which action to take based on what has the most impact on staff or operations and what the risks associated are.
Item Spend Analysis
Item spend analysis refers to analyzing expenditure at an item/ SKU level. It focuses on individual purchases by classifying each one of them to identify what department it was for and what supplier was used.
This analysis gives the ability to know whether a specific item is being purchased from various suppliers or in several locations and at different item prices. It can highlight the different opportunities for purchasing in the business. You may also identify spend leakage issues, such as purchasing from non-preferred vendors and maverick spend.
Payment Term Spend Analysis
Payment term spend analysis provides excellent insights for companies to analyze payment practices and terms within their purchase-to-pay (P2P) processes. It explores the opportunities of leveraging all possible discounts or interest from the invoice payment process while increasing working capital.
Payment term spend analysis gives a comprehensive view that enables you to identify unrealized payment term discounts, late payment interests, or opportunities to negotiate better payment terms.
It also covers the review of payment patterns to identify practices and activities that are not done properly.
Contract Spend Analysis
Finally, contract spend analysis tells companies if they are complying with their existing negotiated contract terms.
It analyzes spending with vendors by contract to identify leakage through non-compliant contracts. It ensures that the best contract deals per supplier have been negotiated and that all buyers purchase from preferred suppliers.
Benchmarking in Spend Analysis
In the journey of spend analysis, one question stands above all: “How do we know if we’re doing well?” While internal data offers a clear lens into your organization’s patterns, it doesn’t always tell you where you stand in the wider world. That’s where benchmarking comes in.
Benchmarking is the practice of comparing your organization’s spend performance to relevant standards—whether that’s your historical data, industry averages, or peer group best practices. Done right, benchmarking transforms raw numbers into actionable insights and can turn “good enough” into “industry-leading.”
This chapter explores the different ways to approach benchmarking in spend analysis, the value of peer-based Community Data, and how you can use these tools to fuel smarter, more strategic procurement decisions.
Why Benchmarking Matters
Imagine you’ve negotiated a payment term of Net 45 with a key supplier. Is that a win, or could you have pushed for Net 60? Benchmarking gives you the external reference points you need to answer these questions with confidence.
Key benefits of benchmarking in spend analysis include:
- Identifying Hidden Opportunities: Spot areas for improvement that get missed when only looking internally.
- Validating Success: Celebrate when you’re ahead of the curve, and double down on proven strategies.
- Driving Stakeholder Alignment: Data-backed comparisons help bring procurement, finance, and leadership onto the same page.
- Fueling Negotiations: Enter supplier discussions with hard evidence and a clear sense of what’s possible.
Types of Benchmarking in Spend Analysis
There are several approaches to benchmarking your procurement performance. Each comes with its own strengths, limitations, and best-use scenarios.
1. Internal Benchmarking
This involves comparing spend and procurement KPIs across your own business units, regions, or time periods. For example:
- Measuring cost savings year-over-year for a given category.
- Comparing payment term compliance across subsidiaries.
Pros:
- Immediate access to data.
- Useful for tracking progress and enforcing internal standards.
Cons:
- Cannot reveal how you stack up against the market.
- May reinforce inefficient habits if internal standards are suboptimal.
2. Industry/Third-Party Benchmarking
Here, you compare your metrics to external industry averages provided by consultants, trade groups, or research firms.
Pros:
- Can reveal high-level trends and averages.
- Useful for common categories or broad operational KPIs.
Cons:
- May be based on survey data or limited samples, not real transactions.
- Often lacks the granularity or context for specific suppliers, geographies, or niche categories.
3. Peer-Based Community Data Benchmarking
The newest frontier is peer-based benchmarking, powered by aggregated and anonymized real spend data from a large community of organizations–Sievo Community Data. Sievo’s Community Data takes benchmarking to a new level by leveraging anonymized, validated, and aggregated spend data from 2%+ of global GDP, covering 100M+ suppliers and 9.5M+ material codes
How it works:
Transactional data points, such as payment terms, category-level prices, and supplier choices, are gathered from a broad base of companies, thoroughly anonymized and aggregated, and provided back as benchmarks.
Pros:
- Based on real-world, recent transactions, it is more accurate than surveys or estimates.
- Deep coverage across categories, suppliers, and countries.
- Enables tailored recommendations in context (e.g., “companies like yours in your region typically achieve Net 60 with this supplier”).
Cons:
- Requires participation in a data-sharing ecosystem (with strict anonymity and aggregation).
- Coverage may vary by category or supplier density.
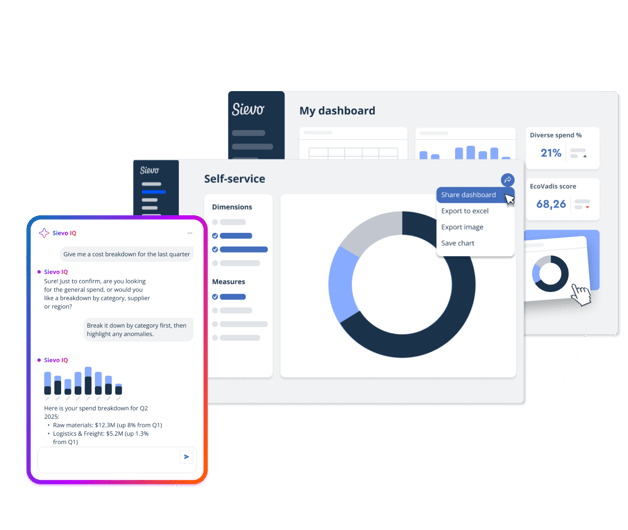
From Dashboards to Insights
As AI and automation increasingly take over the early stages of analysis, the way we interact with data is changing. Tools like Sievo IQ surface key insights directly, often through conversational interfaces or intelligent prompts, reducing the need to manually explore dashboards to find answers.

Example of Sievo Insights Hub
However, even in an insight-first approach, dashboards play a vital role in providing support. They help:
- Confirm patterns identified by algorithms
- Visualize trends for easier interpretation
- Communicate findings across teams and stakeholders
Procurement data rarely speaks for itself, which is why strong visualizations still make a difference. The following section explains the visualization types that are most effective in this role and when to use them.
Bar Charts
Bar charts are versatile and effective for comparing values across different categories.
They are commonly used to visualize spend by category, supplier, or business unit.
Stacked bar charts show the total value broken down into sub-categories, making them useful for comparing the composition of spending across different categories or suppliers.
Pie Charts
Pie charts represent parts of a whole and are useful for showing the distribution of spend across different categories or suppliers.
They provide a clear visual representation of the proportion of spending in each category.
Line Charts
Line charts are useful for visualizing trends over time and illustrating changes in spending patterns or supplier performance. They can help identify seasonal fluctuations or long-term trends in spending.
Heat Maps
Heat maps use color gradients to represent data values and are effective for highlighting areas of high or low spending. They can be used to visualize spend by geography, department, or other categorical variables.
Bubble Charts
Bubble charts represent data points as bubbles, with the size of the bubble indicating the value of the data point. They can be used to visualize spend by supplier, with larger bubbles representing higher spending.
Treemaps
Treemaps use nested rectangles to represent hierarchical data structures, making them useful for visualizing hierarchical relationships in spending data. They can be used to show spend by category, with larger rectangles representing higher spending categories.
Scatter Plots
Scatter plots visualize the relationship between two variables and are useful for identifying correlations or patterns in spending data. They can be used to visualize the relationship between spend and performance metrics such as supplier quality or delivery times.
Pareto Charts
Pareto charts combine both bar and line graphs to represent categorical data and their cumulative totals.
They are useful for identifying the most significant categories or suppliers contributing to total spend, highlighting the "80/20 rule" where a significant portion of spend comes from a small number of categories or suppliers.
Sankey Diagrams
Sankey diagrams visualize flow between nodes in a network, representing the magnitude of flow using the width of the lines.
They are useful for visualizing the flow of spending between different categories, suppliers, or business units, providing insights into how spending is distributed and transferred.
Waterfall Charts
Waterfall charts illustrate the cumulative effect of sequential positive and negative values, showing how an initial value is affected by subsequent changes.
They are useful for visualizing changes in spending over time, such as the impact of cost-saving initiatives or changes in supplier contracts, by showing the net effect on total spend.
Spend Analytics Dashboards
A spend analytics dashboard is a dashboard that visualizes sets of spend data into charts for the purpose of analysis. Datasets are selected based on predefined parameters, business targets, or KPIs.
The benefit of a dashboard is an instant high-level view of spending. In this chapter, we will cover some basic spend analysis dashboards used in Sievo.
Spend overview dashboard
A Spend Overview Dashboard provides an overview of your spend performance by comparing data of one selected period to the previous one. In the example, the view is filtered by year-to-date and presents the data by three four aspects: category, organization, supplier, and supplier count.

With a dashboard like this, you can track the top suppliers by region, spend changes by category, purchase process developments, as well as supplier count developments.
A proper spend analytics dashboard should be interactive, meaning you can select and filter data directly on the charts. Depending on what your responsibilities are, you can use a spend analytics dashboard to gain insights to questions or goals in mind with just one click.
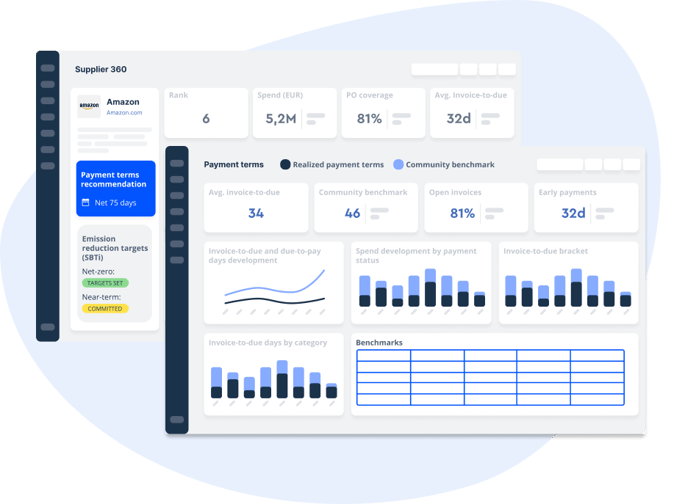
Supplier Performance
A Supplier Performance Dashboard visualizes key data for a specified supplier, offering a 360-degree perspective. It highlights analytics on the top supplier by spend ranking, providing transparency into purchases and payment terms across business units.
This overview allows you to compare suppliers, identify performance opportunities, and strategize meetings for renegotiating or ensuring compliance with better payment terms.
Category Performance
The Category Performance Dashboard visualizes key data for a selected category, showing spend distribution, purchase order development, material price trends, and supplier sources. It offers valuable category management insights, helping to identify price opportunities, single-supplier risks, and track purchase order compliance. You can also drill down to assess purchase price developments at the lowest category level.
Supplier Base Performance
A Supplier Base Performance Dashboard lets you analyze your entire supplier base, track top and tail-spend suppliers, and identify consolidation opportunities to mitigate risks and create savings.
It is ideal for tail spend analysis and internal benchmarking, showing how fragmented or consolidated your supplier base is across different business units in a single category.
Sourcing Performance
A Sourcing Performance Dashboard shows from which regions your business units are sourcing and whether materials are sourced internationally or domestically. It helps assess regional risks and anticipate the impact of trade or geopolitical issues.
This dashboard is useful for managing regional risks and identifying savings in logistics by switching to geographically closer suppliers.
Process Performance
A Process Performance Dashboard highlights improvement areas for small POs/invoices, revealing potential savings by identifying suppliers with small value transactions. It shows category differences in invoice/PO quantities and amounts, helping to spot discrepancies between business units or suppliers for process optimization.
This dashboard is useful for analyzing invoice and PO counts, benchmarking average values, and streamlining the purchase process.
Price Performance
A Price Performance Dashboard analyzes price differences among suppliers, helping identify opportunities for negotiation or finding cheaper options. It provides global and regional insights into price ranges within specified categories, aiding in price discovery and supplier selection. This dashboard is useful when you want to discover the price range of your specified category.
Currency Performance
A Currency Performance Dashboard provides an overview of spend distribution in various currencies, highlighting categories or suppliers purchased using different currencies. It enhances transparency regarding risks, such as foreign exchange fluctuations. Filtering by category or supplier allows identification of materials or suppliers vulnerable to currency strengthening, aiding in proactive risk management.
Custom Dashboards
The ready-made charts in the Sievo dashboards can give you a great overview with only one click. But what if you cannot find one matching your goal in mind?
What you will need is a Custom Dashboard, where you can mix and match any dimension, measure, and chart type for any report you need and slice and dice with any data point you want. This is especially useful for your presentations. The image below shows how Sievo's Self Service Craftboard allows you to build reports to meet your specific needs.
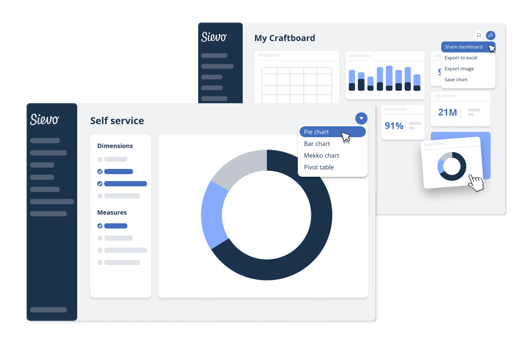
Example of Sievo’s Self Service Dashboard
Spend Analysis Tools
There are many tools available for analyzing procurement spend ranging from simple Excel Spreadsheets to advanced analytics software. Here you can find the summary of the pros and cons of each alternative.

Pros and Cons of Conducting Spend Analysis in Excel
Excel remains a widely used tool for conducting spend analysis in many organizations. Its accessibility and familiarity make it a go-to choice for analyzing spend data. While Excel can be a useful tool for basic analysis, it has significant limitations when it comes to handling large datasets, handling advanced procurement analytics, maintaining data accuracy, and delivering comprehensive insights.
Small-medium size organisations may conduct relatively successful analysis in excel, but large enterprises looking to scale their procurement analytics and improve efficiency should consider investing in dedicated spend analysis software. Why so? Let's explore the pros and cons of using Excel for spend analysis in detail:

Pros of Using Excel for Spend Analysis
Accessibility and Familiarity
Excel is a readily available tool in almost every organization. Most procurement professionals are familiar with its interface and functionalities, making it easy to get started with spend analysis without the need for extensive training or additional software.
Flexibility
Excel offers flexibility in terms of data manipulation and customization. Users can build custom formulas, pivot tables, and charts to analyze their spend data in different ways. This allows for a tailored approach to spend analysis, accommodating specific business needs.
Cost-Effective
For small organizations or those with limited budgets, Excel provides a cost-effective solution for basic spend analysis. There's no need to invest in expensive spend management software, making it a practical option for companies with limited data and resources.
Custom Reporting
Excel allows users to create customized reports and visualizations, offering a degree of control over how data is presented. This can be beneficial for creating specific reports for stakeholders or executives.
Cons of Using Excel for Spend Analysis
Scalability Issues
One of the major limitations of Excel is its inability to handle large datasets effectively. Spend analysis often requires processing thousands or even millions of rows of data, and Excel struggles to scale with such volumes. As the data size grows, performance issues such as slow processing and potential crashes become more common.
Manual Data Entry and Errors
Excel relies heavily on manual data entry, which increases the risk of human error. Even minor mistakes in formulas or data input can lead to inaccurate analysis and faulty decision-making. Manual processes also consume significant time and resources, reducing the efficiency of the spend analysis process.
Inconsistent Data and Classification
Spend data in Excel is often prone to inconsistencies, such as variations in supplier names, regional formatting differences, and data classification issues. Handling these discrepancies manually can be time-consuming and may result in overgeneralized or incorrect categorizations, impacting the accuracy of the analysis.
Lack of Automation
Unlike dedicated spend analysis tools that offer automated data cleansing, classification, and reporting, Excel requires repetitive manual processes for updating and analyzing data. This lack of automation means that procurement teams spend more time on administrative tasks rather than gaining actionable insights.
Limited Reporting and Analysis Capabilities
Excel's reporting capabilities are limited compared to specialized spend analysis platforms. While Excel can create basic visualizations, it lacks advanced features like real-time data updates, interactive dashboards, and the ability to slice and dice data in multiple ways. This limits the depth of analysis and the ability to generate comprehensive insights.
Data Security and Collaboration Challenges
Excel files are often shared through email or cloud storage services, raising concerns about data security and version control. Additionally, collaboration can be challenging when multiple stakeholders are involved, leading to issues such as conflicting file versions and miscommunication.
Learn more about the pitfalls of in-house analytics tools
Pros and Cons of Using BI Tools for Spend Analysis
Business Intelligence (BI) tools are a type of application software used to collect, structure, and visualize large amounts of data. While BI tools are commonly used across various business functions, they are particularly effective for spend data analysis. These tools help organizations gain deep insights into their spending patterns, aligning expenditures effectively with revenue, and driving smarter procurement decisions. Here’s a detailed look at the pros and cons of using BI tools for spend analysis, incorporating insights on Total Cost of Ownership (TCO), implementation challenges, and procurement-specific requirements:
Pros of Using BI Tools for Spend Analysis
Enhanced Data Visualization
BI tools excel at creating interactive dashboards and visualizations, making it easy for procurement teams to analyze complex spend data. These tools help users quickly identify trends, spot inefficiencies, and uncover cost-saving opportunities.
Real-Time Data Processing
BI platforms process large datasets in real-time, enabling procurement professionals to work with the latest data. This allows for timely decision-making, which is crucial in responding to supplier performance or market shifts.
Scalability and Flexibility
BI tools are scalable, accommodating the growing data needs of organizations of all sizes. They provide flexibility by allowing users to customize dashboards and reports based on specific procurement needs, which helps in tailoring analysis to different stakeholders.
Integration with Other Systems
BI tools can integrate with other enterprise systems, such as ERP and CRM platforms, to create a more comprehensive view of procurement data. This integration helps in pulling data from multiple sources for more holistic spend analysis.
Cons of Using BI Tools for Spend Analysis
Limited Procurement-Specific Features
While BI tools offer broad data analysis capabilities, they lack the procurement-specific functionalities found in dedicated spend analytics platforms. Dedicated spend analysis solutions come with pre-built features and procurement-specific metrics that BI tools do not natively support.
Higher Total Cost of Ownership (TCO)
BI tools can have a high total cost of ownership. This includes software licensing fees, customization costs, infrastructure investments, and ongoing support and training. For organizations with complex procurement needs, these costs can quickly add up. The TCO can be higher than expected, particularly if multiple tools are required to manage different aspects of spend analysis.
Longer Time to Value
One of the major challenges with using BI tools for spend analysis is the longer time to value. Implementing and customizing BI tools to handle procurement-specific data often takes significant time and development resources. This delays the realization of cost savings and efficiency improvements, resulting in missed opportunities as organizations wait for full spend visibility and actionable insights.
Customization and Configuration Challenges
While BI tools are flexible, they often require extensive customization to meet the unique needs of procurement teams. Configuring dashboards, creating procurement-specific reports, and structuring data for spend analysis can be time-consuming and resource-intensive. This complexity can delay the deployment of effective procurement analytics compared to pre-configured spend analysis solutions.
Security and Data Privacy Concerns
The handling of sensitive procurement data in BI tools, particularly cloud-based ones, can raise security and privacy concerns. Proper encryption, access controls, and compliance measures are necessary to protect against data breaches, adding to the overall cost and complexity of using BI tools.
Complexity in Data Interpretation
BI tools provide significant flexibility, but this can also lead to variability in how data is interpreted. Different users may draw different conclusions from the same data, leading to inconsistencies in decision-making across the organization. Without standardized procurement data management processes, this flexibility can create challenges in maintaining alignment.
Lack of Procurement-Specific R&D and Innovation
BI tools have limitations when applied to procurement-specific use-cases. The lack of procurement-specific features make BI tools less suitable for more complex procurement environments and larger enterprises.
Specialized procurement analytics providers, such as Sievo, continually innovate and collaborate with industry-leading procurement teams and third-party data providers to enhance their procurement analysis capabilities. BI tools typically lack the same level of focus or investment in procurement R&D, which can limit their effectiveness in advanced spend analytics.
Spend Analysis Software
Spend analysis software helps procurement teams gain a deep understanding of how money is spent across the organization. Unlike Excel or general Business Intelligence (BI) tools, spend analysis platforms are explicitly designed to meet the needs of procurement to support sourcing, supplier management, and cost control.
What Does Spend Analysis Software Do?
- Centralizes procurement data from ERP systems, P2P platforms, and third-party sources regardless of data complexity or structure
- Automates data cleanup and categorization using AI and machine learning even with customized taxonomies and messy source data
- Uncovers savings opportunities, flags supplier risks, and tracks sustainability metrics
- Supports procurement-specific needs like contract compliance, supplier consolidation, and category management
Spend analysis software is particularly useful for large enterprises that need scalable ways to manage procurement data. They offer faster time to insight, secure system integrations, and access to procurement-specific innovation and support. For smaller organizations, lighter options like Excel or BI tools may be a more practical starting point until their procurement needs grow.
Benefits of Using Spend Analysis Software
Seamless Data Aggregation and Processing
One of the core benefits of spend analytics software is its ability to pull procurement data from multiple sources, including ERP systems, supplier portals, external benchmarks, and more. With automated connectors, teams can skip the time-consuming data preparation and proceed directly to analysis.
Key capabilities include:
- High-volume transaction processing
- Multi-level analysis across categories, suppliers, or business units
- Regular data refreshes to maintain accuracy
AI-Powered Data Cleansing & Enrichment
One of the most significant differentiators of spend analysis software is its ability to automatically classify and enrich selected data. This automation dramatically reduces the time and effort required for data preparation while improving accuracy and consistency throughout the organization.
Key capabilities include:
- Categorizing spend across detailed taxonomies
- Normalizing supplier names and grouping parent-child entities
- Identifying duplicate entries across systems (e.g., contracts or materials)
- Enhancing records with public datasets, market intelligence, or industry benchmarks
Procurement-Specific Insights
Purpose-built spend analysis platforms offer analytics capabilities specifically designed for procurement use cases. Organizations using specialized procurement analytics report faster identification of savings opportunities and more strategic supplier relationship management compared to those relying on general-purpose tools.
Key capabilities include:
- AI-generated savings insights prioritized by impact
- Supplier consolidation opportunities and risk assessment
- Contract compliance and performance monitoring
- Sustainability analytics, including Scope 3 emissions tracking
- Conversational analytics for natural language queries
- Immediate actions taken with AI Agents and automated actions
Fast Time to Value And Continuous Improvement
A key advantage of purpose-built spend analysis platforms is their ability to deliver fast time to value through pre-configured dashboards, templates, and workflows. These features reduce implementation time and enable teams to generate value early.
Ongoing product development, often done in collaboration with users, ensures that spend analysis platforms continue to evolve with changing procurement needs and industry best practices.
Key capabilities include:
- Collaborative product development based on user feedback and industry needs
- Training, onboarding, and support tailored for procurement teams
- Regular platform enhancements addressing evolving procurement challenges
- Fast access to actionable spend and supplier insights
Peer Benchmarking
Spend analysis software can also aggregate anonymized procurement data across multiple organizations. This aggregation provides external benchmarks that help teams evaluate their performance and identify opportunities to improve supplier terms, pricing, and sourcing strategies.
Key capabilities include:
- Payment terms benchmarks by supplier, category, or region
- Category-level pricing trends to support cost savings and renegotiation
- Suggested supplier alternatives
- Alerts on supplier changes, such as mergers or ownership shifts
 Cons of Using Spend Analysis Software
Not Always Suitable for Small and Medium-Sized Enterprises (SMEs)
The advanced features of spend analysis software come at a premium, making these platforms less accessible for organizations with more limited budgets. The cost associated with implementing these platforms can be too high for SMEs, which may not have the volume of data or budget to justify the investment.
In these cases, lighter-weight solutions like Excel or BI tools may be more appropriate. For larger organizations, however, the investment is typically justified by the efficiency gains and cost savings these platforms deliver.
Seemingly Limited Customization
While spend analysis software offers extensive features tailored to procurement, customization may be more constrained compared to open-ended tools like Excel or Power BI. That said, some vendors are bridging this gap with capabilities such as:
- Visual tools for tailoring reports to business needs
- Self-service dashboards for users to build custom reports without developer support
These features aim to strike a balance between flexibility and the structure of a dedicated analytics platform.
Conclusion on Spend Analytics tool choice
Spend analysis software offers significant advantages over Excel and BI tools, particularly for large enterprises with more complex needs. With features like procurement-specific analytics, faster time to value, and dedicated R&D, these platforms enable organizations to optimize their strategies and drive 360° cost savings.
Leading providers like Sievo stand out in the market with extensive industry experience, year-after-year industry recognition, and commitment to joint innovation with top enterprise clients. However, for smaller organizations, advanced features and depth of insights may not be mandatory elements, and lighter solutions like Excel or BI tools might be a better fit until their procurement needs and ambition level grow to a larger scale.

10 Best Practices in Modern Spend Analysis
Procurement teams seeking to maximize value from spend analysis frequently ask how to structure their approach, what to prioritize, and how to transition beyond manual reporting. The following 10 best practices help ensure that spend analysis delivers consistent, actionable results across categories, suppliers, and regions.
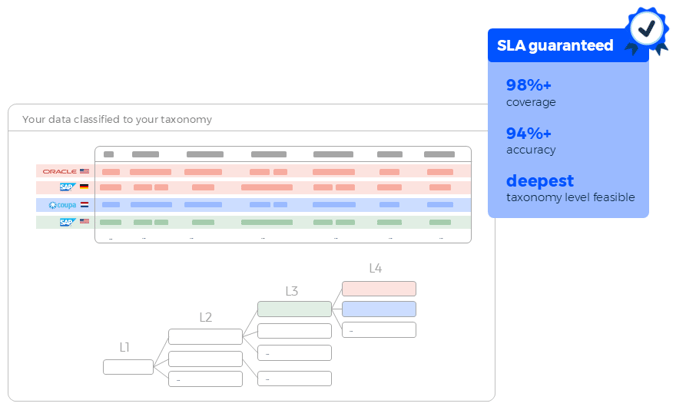
1. Apply AI to Spend Classification
Classification is where most spend analysis efforts begin—and where many slow down. Manual methods often fall short at scale, so the first step is to apply machine learning to automate classification. To do this well:
- Use machine learning algorithms for automated classification with 98%+ coverage
- Apply continuous learning systems that refine accuracy over time
- Use AI to detect and classify emerging spend categories automatically
- Utilize natural language processing to handle unstructured or line-level descriptions
2. Establish Dynamic Taxonomies
Once classification is in place, you need a category structure that supports it. A static taxonomy might work in year one, but it quickly becomes outdated as suppliers, sourcing strategies, and business units change. To keep your taxonomy flexible:
- Create taxonomies that reflect evolving sourcing and procurement needs
- Implement AI-driven taxonomy suggestions based on spend patterns
- Use predictive classification to anticipate new category requirements
- Push taxonomy updates globally to maintain consistency across teams
3. Automate Data Processing
Spend analysis relies on having current and clean data. Manual data preparation slows down insight generation and increases the risk of error. To automate this part of the process:
- Set up data pipelines from ERP, procurement, and finance systems
- Add self-healing logic to fix recurring formatting or mapping issues
- Use automated anomaly detection for data validation
- Create predictive maintenance for data infrastructure
4. Handle Exceptions
Not all transactions will be classified correctly, even with automation. You should have exception-handling workflows to route edge cases to the appropriate teams.
Build a review layer that includes:
- Route low-confidence transactions to analysts for manual review
- Use task queues or approval flows to manage flagged records
- Detect duplicate or unusual patterns using machine learning
- Normalize suppliers by linking aliases to a parent entity
5. Enrich Spend Data with External Data
Internal data only goes so far. To add context, especially around price, risk, or ESG, you'll need to integrate external sources:
- Adding price benchmarks from external market indices
- Comparing performance with anonymized peer benchmarks
- Incorporating ESG and sustainability metrics automatically
6. Make Insights Available to Everyone
Siloing spend data strips it of its impact. Democratizing access means more teams can make smarter, faster decisions. To expand access:
- Offer self-service dashboards to finance, operations, and sourcing teams
- Allow users to filter data by supplier, region, category, or time period
- Support natural language queries for common procurement questions
- Enable collaborative decision-making through shared analytics workspaces
7. Connect Analysis to Strategic Procurement Planning
Spend data becomes more valuable when directly tied to strategic goals and planning cycles. Use it to shape category strategies, supplier plans, and budget allocations. To align analysis with strategy:
- Use predictive modeling for strategic scenario planning
- Measure current progress against sourcing or sustainability targets
- Adjust category plans based on market trends or supplier risk signals
8. Bridge the Data-to-Action Gap
Identifying opportunities is only half the job. To close the gap between insight and execution:
- Implement one-click initiative creation from identified opportunities
- Deploy automated workflow management for savings realization
- Use AI-powered prioritization for opportunity ranking
- Create integrated action tracking with real-time ROI measurement
9. Monitor Risk and Compliance Continuously
Spend analysis can help surface compliance gaps, contract leakage, or supplier instability if you track the right metrics continuously.
Build real-time compliance monitoring by:
- Monitor supplier risk in real time using automated alerts
- Use predictive analytics for contract compliance forecasting
- Deploy automated maverick spend detection and prevention
10. Benchmark Performance Against Peers
Internal performance is easier to interpret when compared against anonymized industry data. Benchmarking helps identify gaps, pricing trends, and areas for improvement. To do it effectively:
- Access peer benchmarks to evaluate pricing, payment terms, and supplier coverage
- Use community learning for classification accuracy improvement
- Deploy collaborative analytics for industry trend identification
Why is Now the Time to Modernize Spend Analysis
Large enterprises are facing familiar pressures: cost volatility, supply chain instability, and growing demands for ESG and operational performance. What's changed is the pace and intensity of those pressures, along with the strategic role procurement is expected to play.
To meet these rising expectations, organizations require greater visibility and the ability to make faster decisions. In many cases, this has led to targeted investment in AI, particularly in areas where manual processes create bottlenecks.
As needs change, the limitations of legacy spend analytics platforms are showing. Most were built for static, periodic reporting, not for the fast and frequent decisions that procurement teams must make today.
Typical pain points include:
- Inconsistent and incomplete data
- Long lead times to generate insights
- No external benchmarks to validate performance
- High dependency on analysts or IT
- Limited ability to identify emerging risks or opportunities
To compensate, procurement teams often rely on manual processes to fill in the gaps. These workarounds create delays, increase workload, and reduce confidence in decisions.
Modernizing spend analytics is about closing those gaps. It provides teams with better visibility, faster access to insights, and increased capacity to respond to change. Teams can now use AI and automation to streamline slow, fragmented processes at scale.
What do modern spend analysis platforms do differently?
Modern spend analytics empower decision-making as it happens: continuously, under pressure, and across multiple stakeholders. They provide:
- Clean, structured data with full spend coverage
- Fast answers through intuitive, conversational interfaces
- Benchmarks based on verified external data
- AI-generated insights focused on risks and opportunities
- Prioritized initiatives based on relevance and value
- Suggested or automated actions that help move decisions forward
Adopting modern spend analytics enables a procurement to be more responsive, focused on impact, and contribute more directly to business priorities. For many organizations, adopting these tools is a key step in meeting new performance expectations.
About Sievo
Sievo provides actionable procurement analytics based on data you can trust.
Designed for large enterprises with $1B+ in revenue, loved by global companies featuring Mars, Levi’s, and Deutsche Telekom, and praised by key analysts, we provide a future-proof solution with immediate ROI.
We empower Procurement, Finance, IT, and Sustainability teams to overcome their data chaos and capture all insights, drive bottom-line savings, improve ESG performance, and streamline budgeting and forecasting.
Sievo goes beyond world-class analytics and dashboards. We help our customers close the data-to-action gap with reliable insights, recommendations, and benchmarks by combining internal, third-party, and cross-customer data.
By processing spend data equivalent to 2% of the world's GDP annually, we enable fast, informed decision-making and deliver the industry's highest data quality with end-to-end data accountability.
Awarded and recognized by top analysts including Spend Matters, ProcureTech, and Procurement Leaders – we offer solutions for Spend Analytics, Procurement Performance Measurement, ESG Analytics, and Financial Planning and Analysis.
We call it procurement excellence - but you can call it Sievo.
Ready to see Spend Analysis in action?

An advanced playbook for Spend Analysis
Delve deeper into best practices for spend analysis, why projects fail, and extra content.