April 2021
Spend Analytics
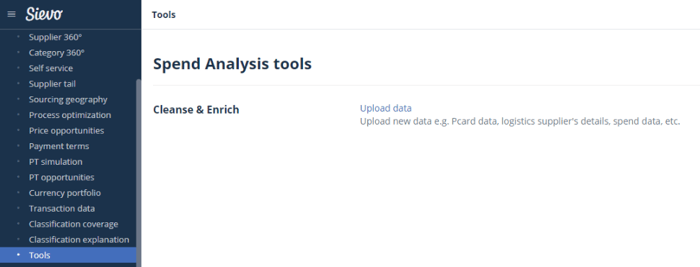
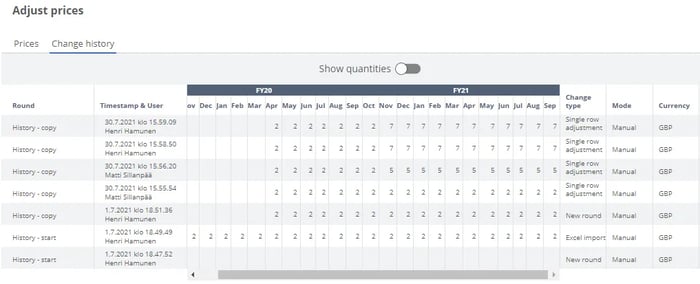
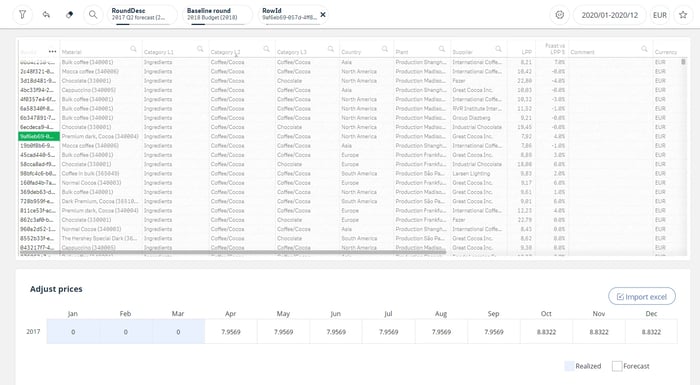
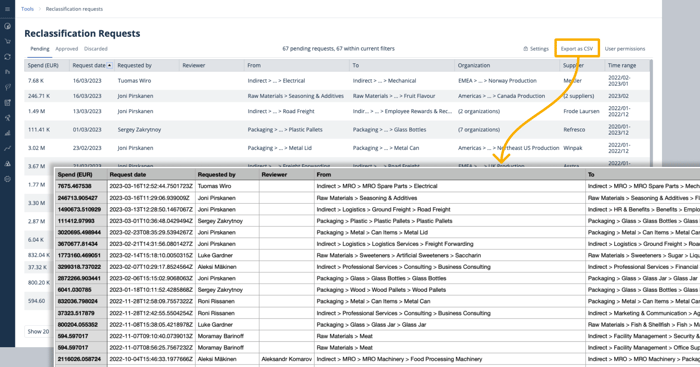
Download 1 million transaction rows!
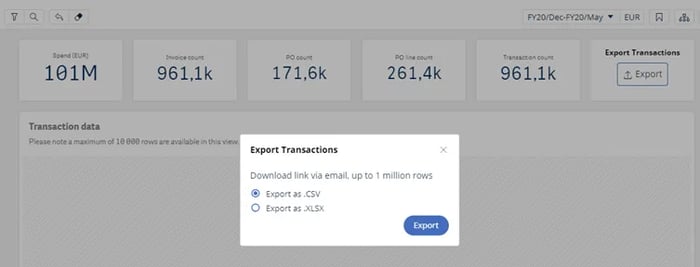
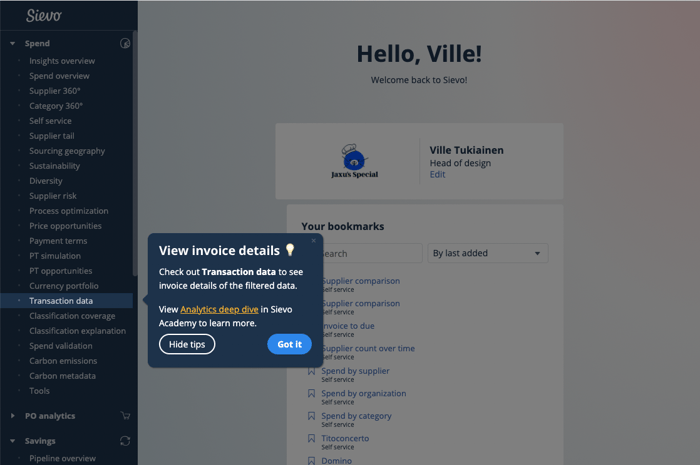
Now you can download up to one million rows of transactions directly from Sievo analytics. This improvement helps reviewing data in familiar tools like Excel, or sharing data with people outside Sievo i.e. to negotiate with a supplier about the prices for a certain material. To download, just hit the export button on the top right corner of the Transaction data dashboard and you will receive a link to the file in your email. Some key details about the feature:
- Sievo admins can control which users can download the full 1 million rows (other users have the default 10’000 row limit).
- The download supports both Excel .xlsx and common .csv formats.
- Each download link is personal, so only you will be able to access the download page
- The download link expires after one week for increased security
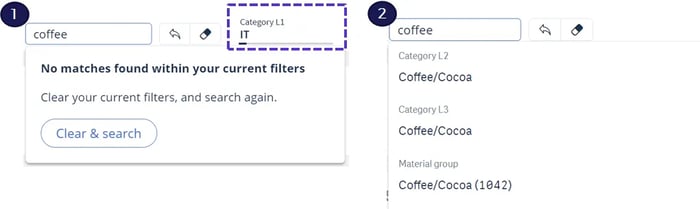
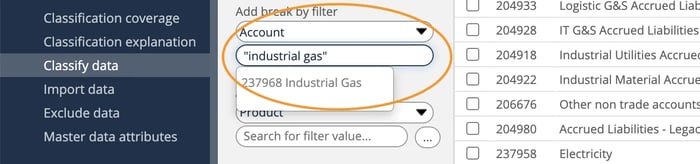
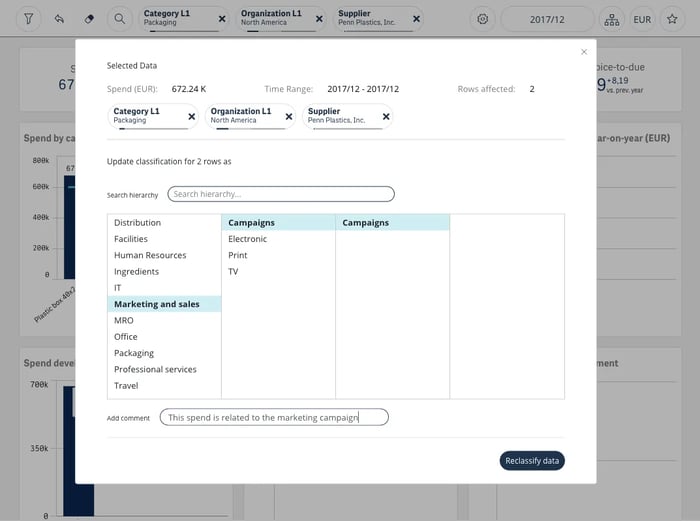
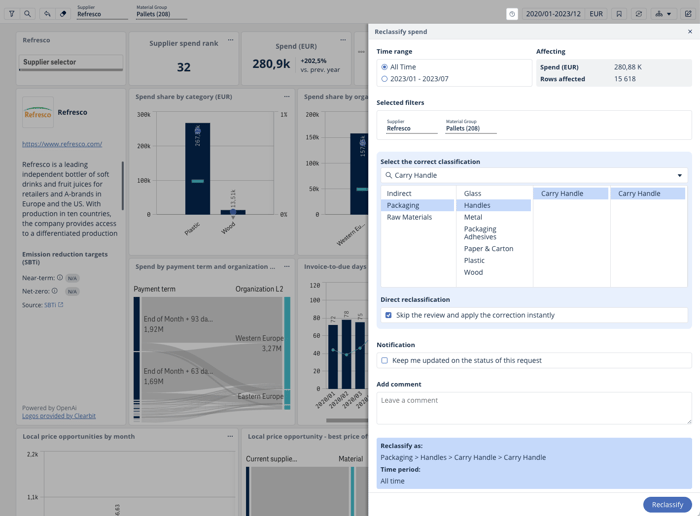
Break by filters alphabetically ordered!
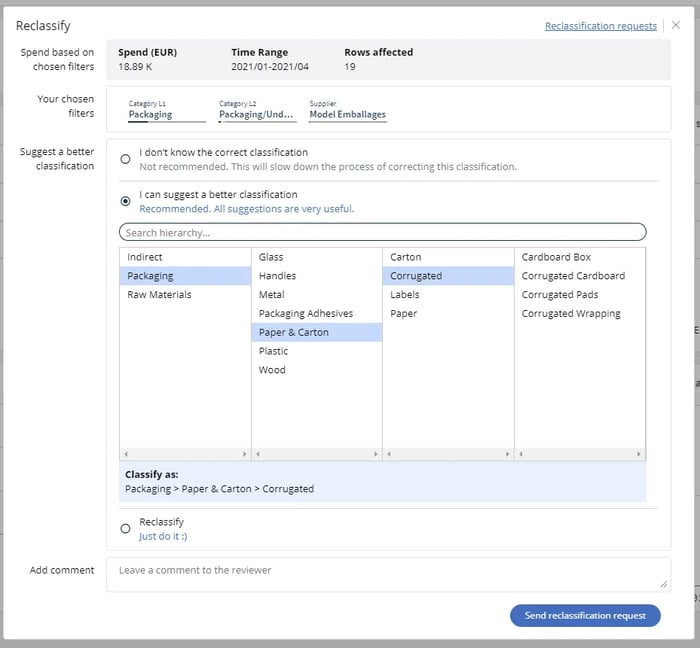
Finding the correct break by to apply filters in the exclusion and heuristic classification tool, has become easier than ever! Now you will find the correct break faster, as they are arranged alphabetically instead of the order they where added in.
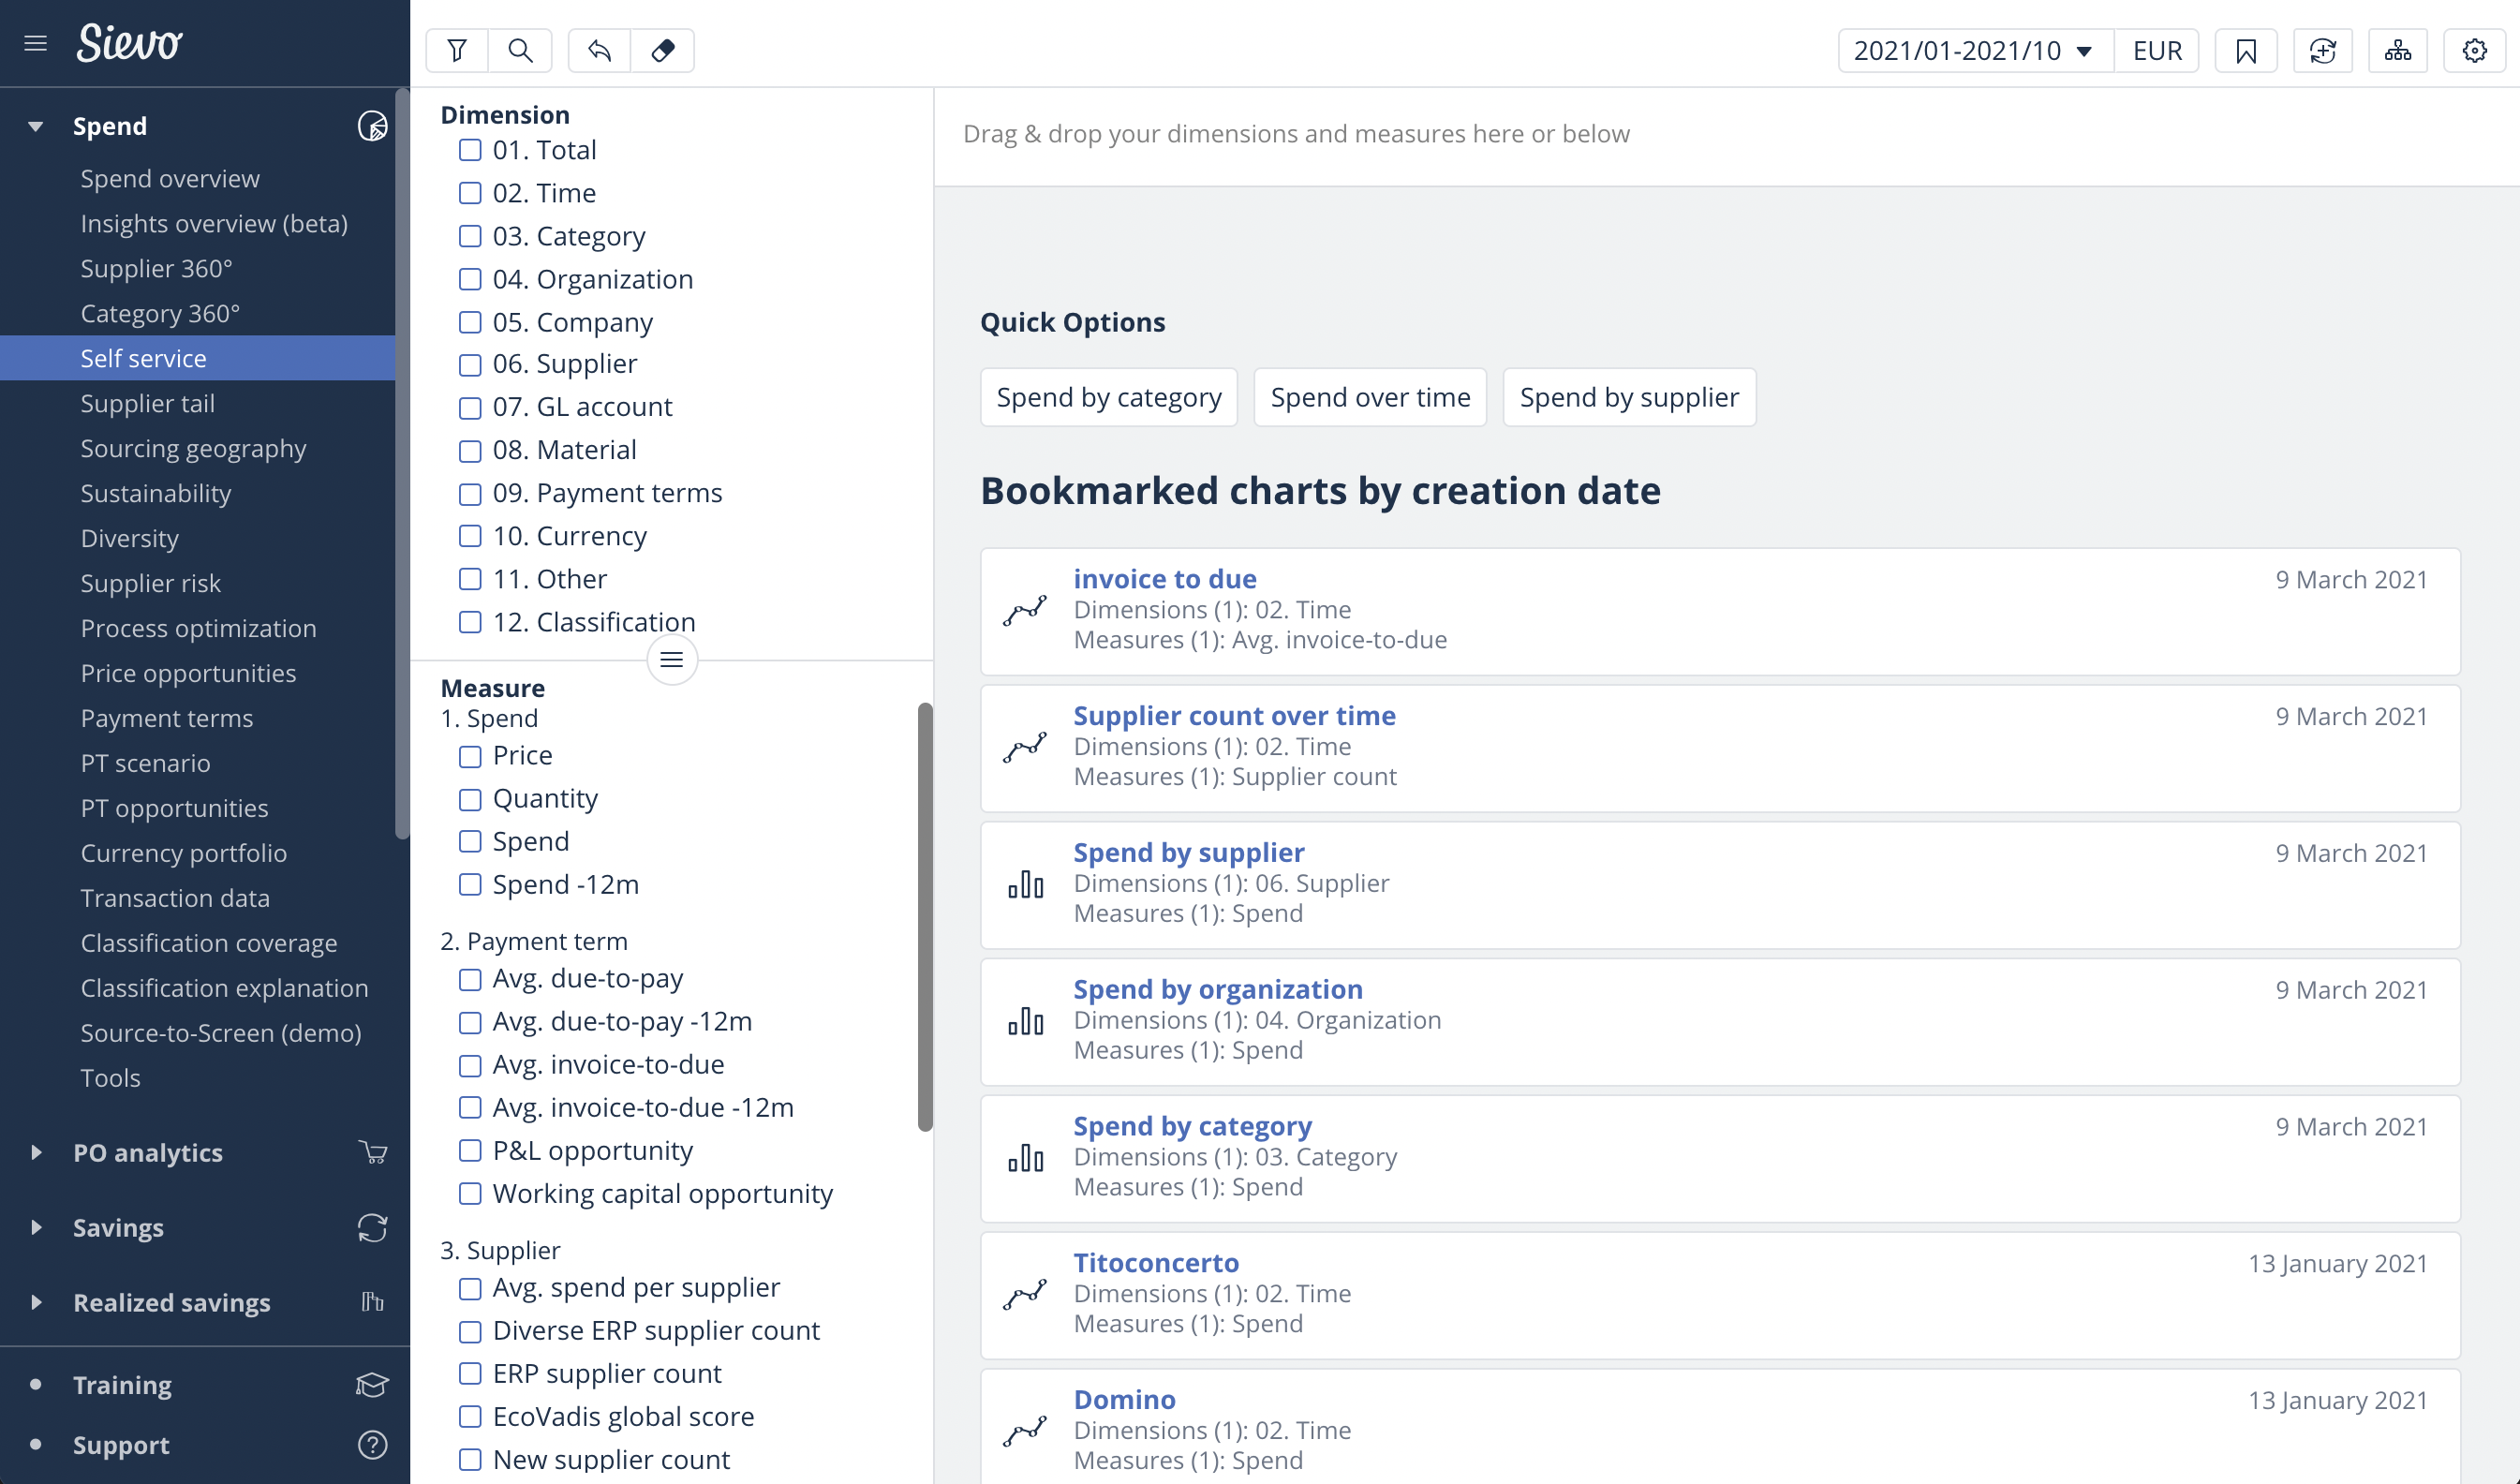
Analytics
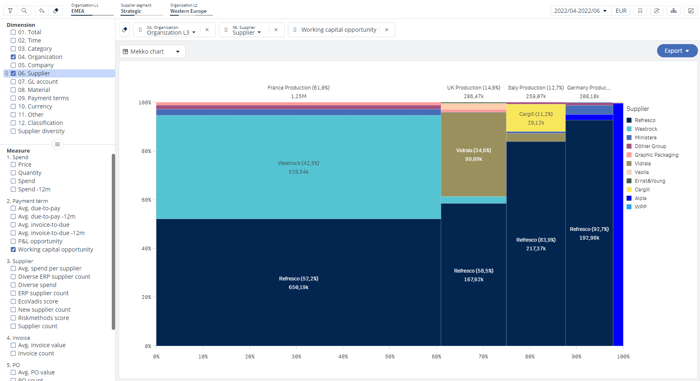
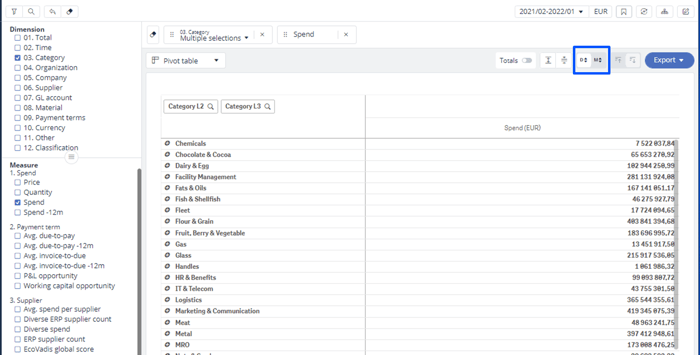
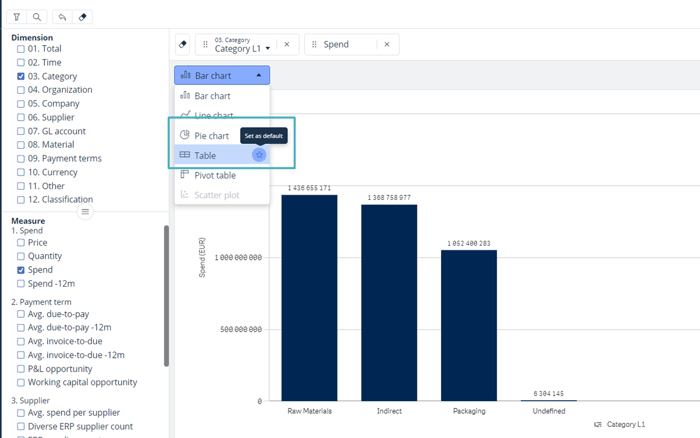
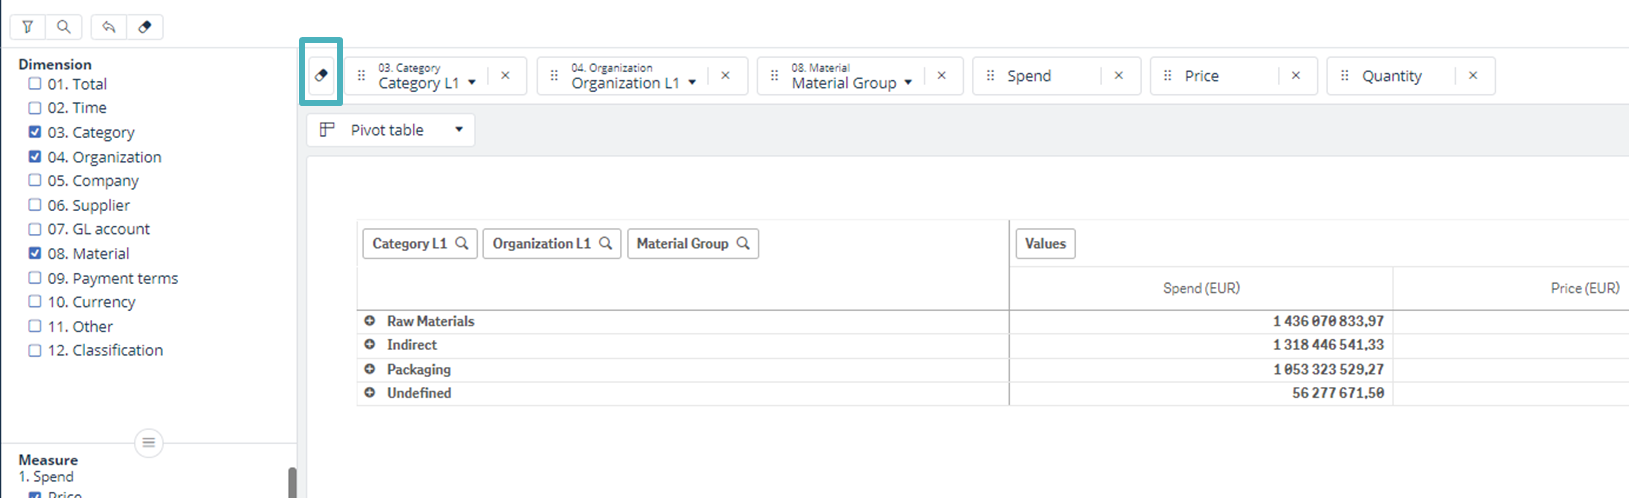
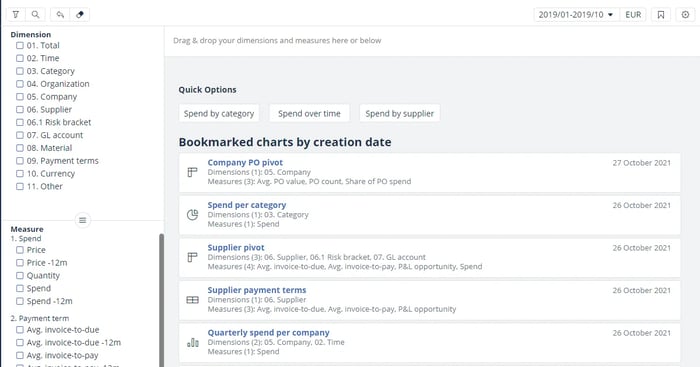
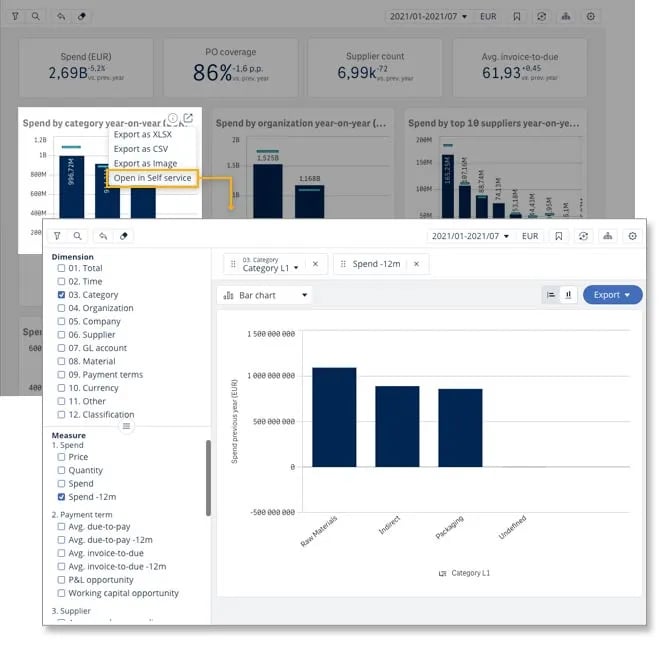
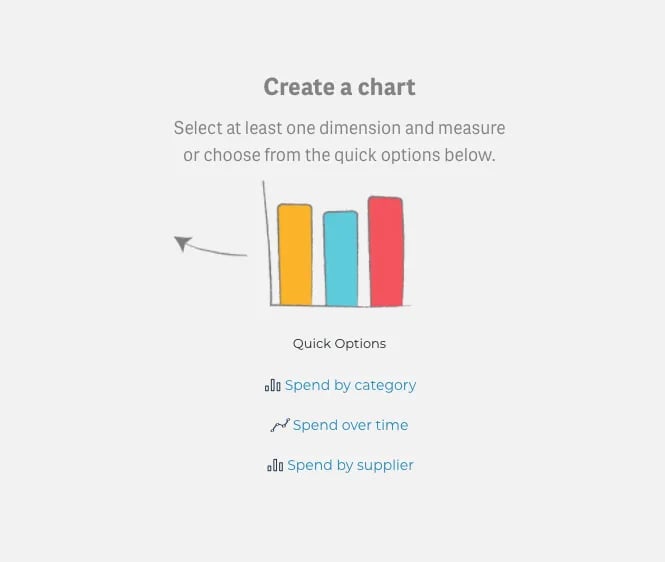
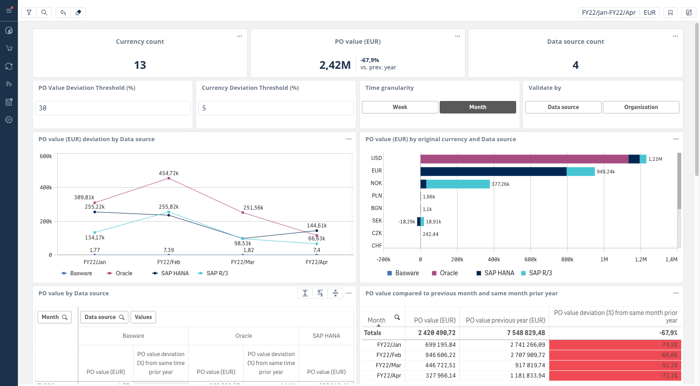
New functionality in Self-service Pivot chart!
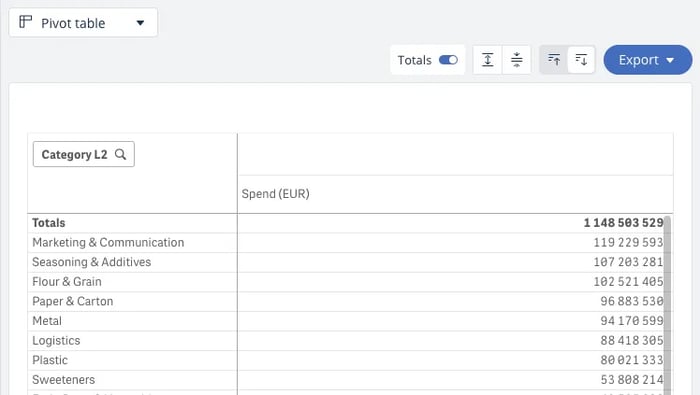
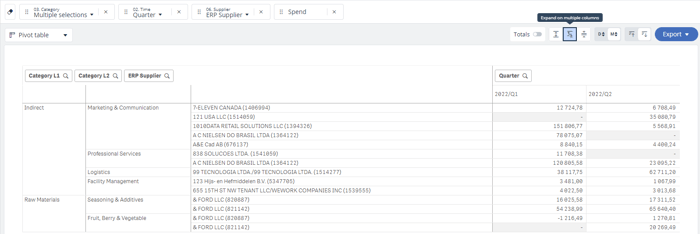
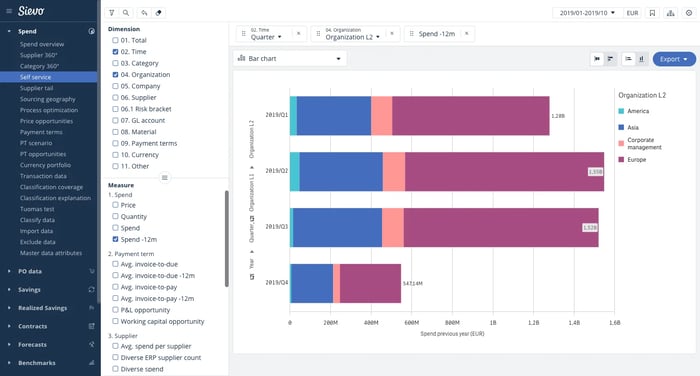
Together with the improved Self-service, we have now added added a bunch of handy tools to the Self-service Pivot charts. Next to the Export button in top right corner, you can now find:
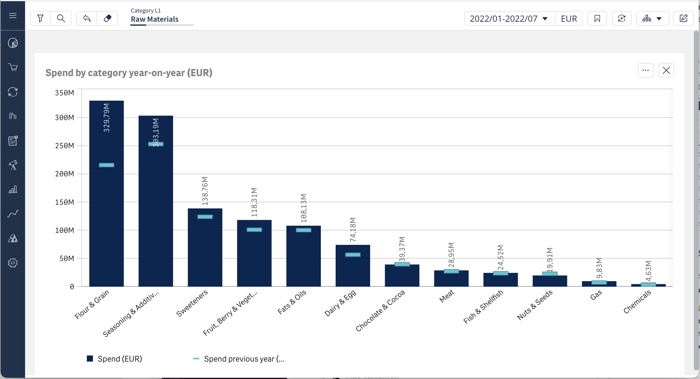
- Show totals – Check the totals e.g. for the whole selection as in the picture below
- Show rows – Expand and collapse all the rows quickly with in click
- Sorting order – Alter the sorting rapidly to be ascending or descending based on your preference
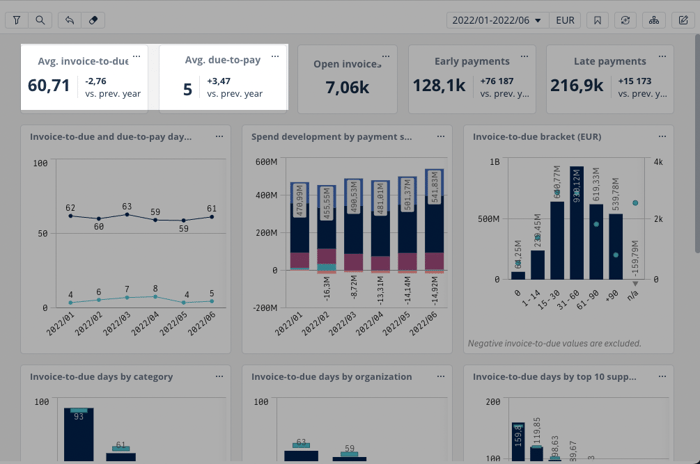
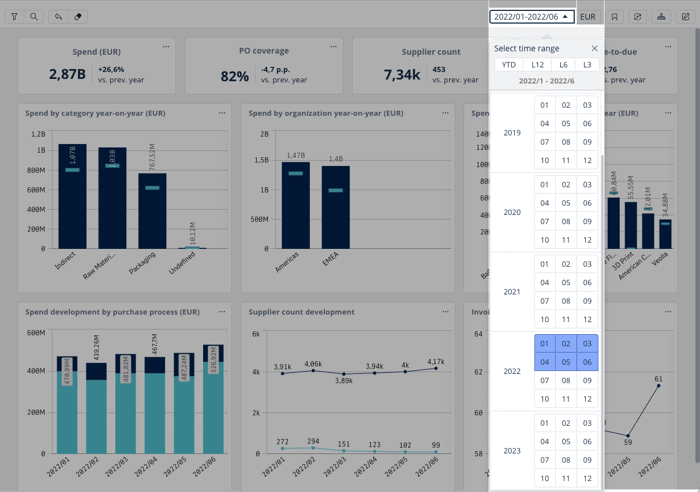
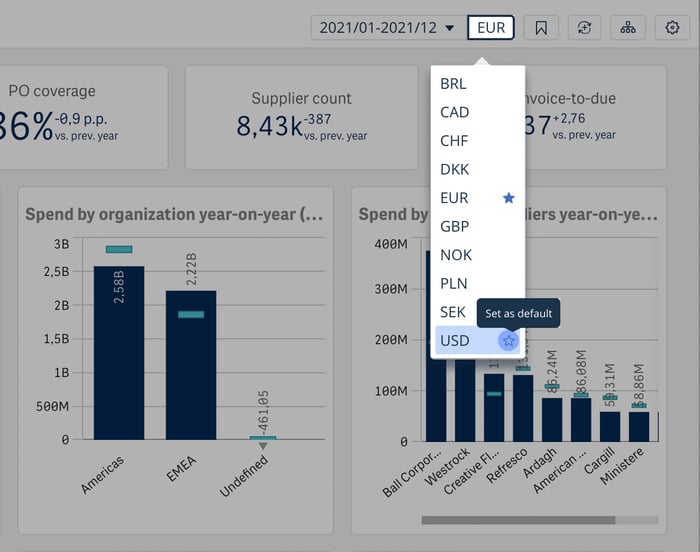
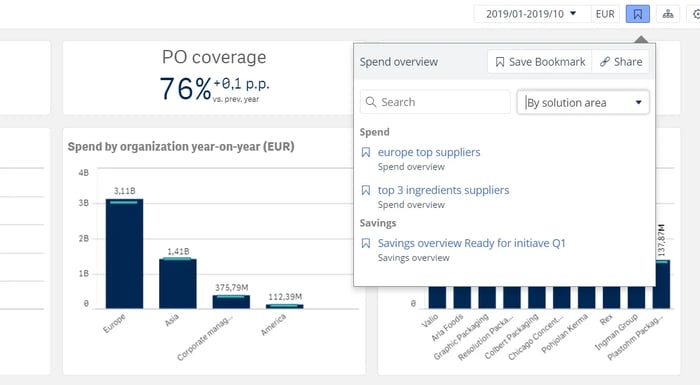
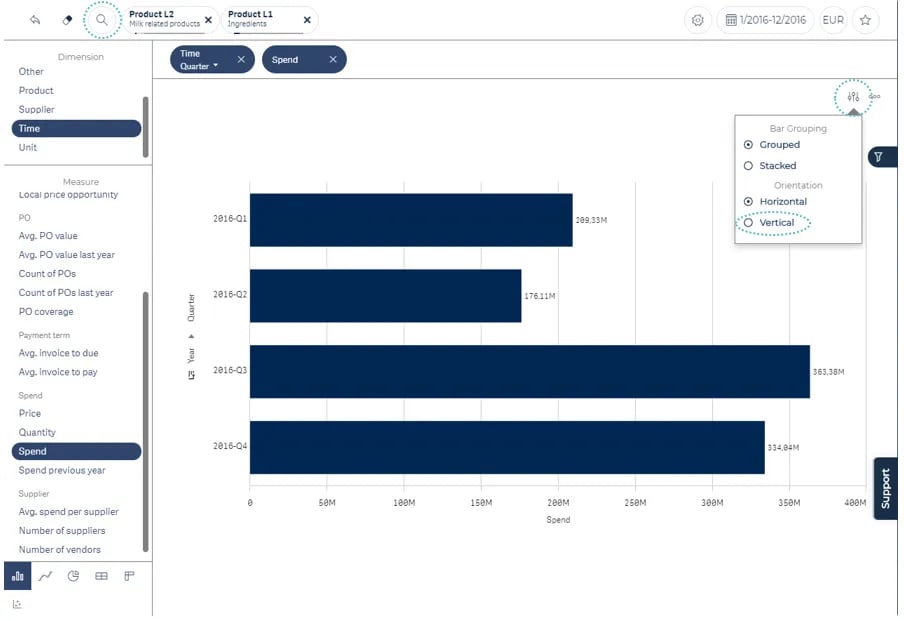
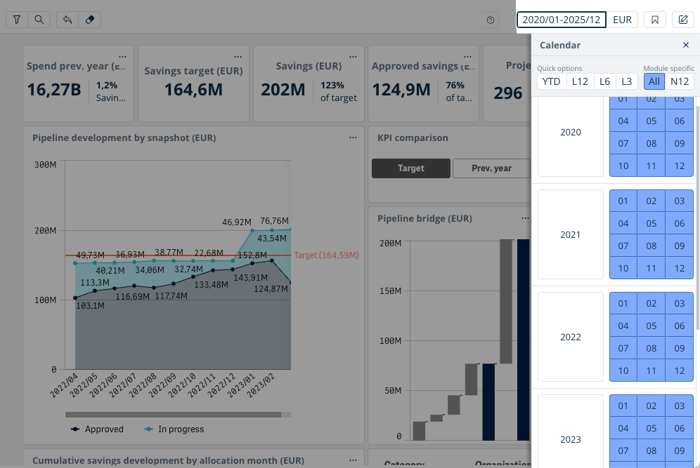
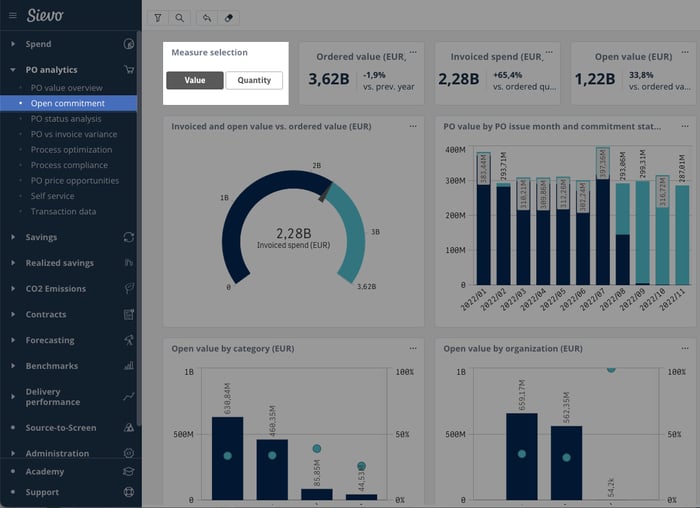
Pin open the analytics Quick Filter bar
To help you quickly add filters while working with dashboards, the quick filter bar can be now pinned open. Just click the pin arrow icon in the top right corner of quick filters and it won’t hide any more (as in the main navigation bar). This feature works across all Sievo dashboards.
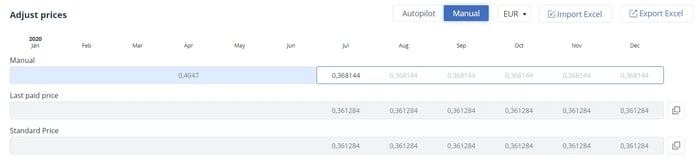
Appropriate amount of decimals in Self-service for better legibility
We will be changing the amount of decimals shown for each measure in the self-service table and pivot charts. This will help you go through the numbers faster, when you see them in a familiar formatting. Here is a few examples of how the measures will be formatted:
- Savings and Spend: 0 decimals
- Price: 4 decimals
- Quantity: 4 decimals
- Invoice to due and due to pay: 1 decimal
- Share of percentage: 1 decimal
- Average supplier invoice and spend: 0 decimals
- All count measures: 0 decimals
- Risk and sustainability scopes: 0 decimals
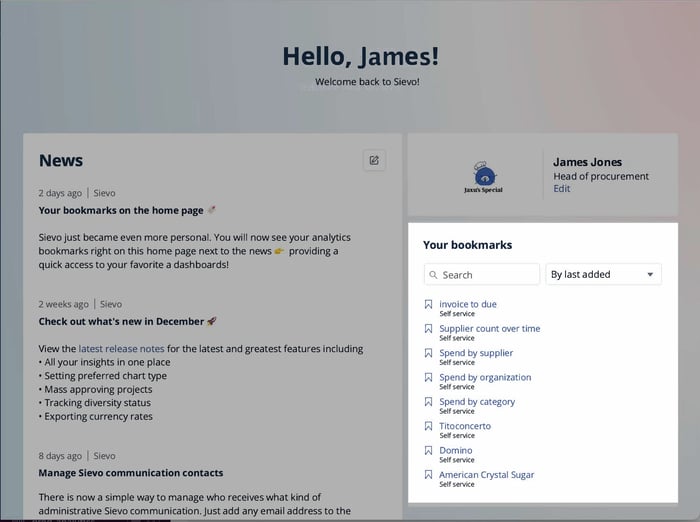
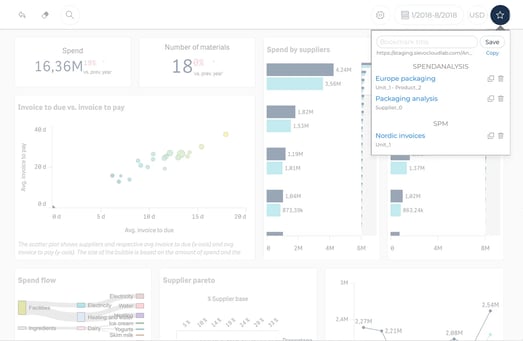
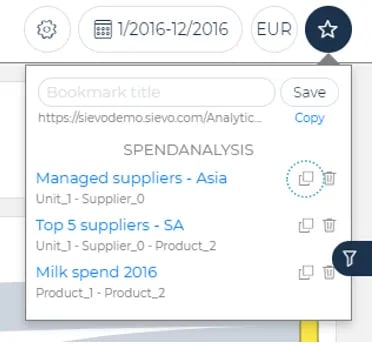
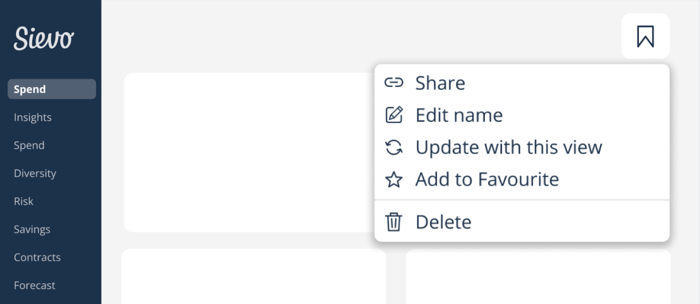
Added security and speed to sharing bookmarks
Links to your shared bookmarks will now expire in 14 day to add security and speed up opening the shared dashboards. To ensure continued access to the shared view (received link), the recipient will need to save it as their own bookmark. If you need access to a view which link has expired, please ask the sender of the link to send a new link to the same view again. This update will not affect your own saved bookmarks in any way.
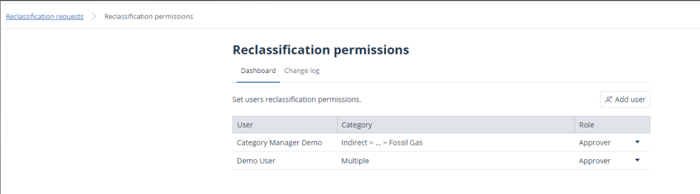
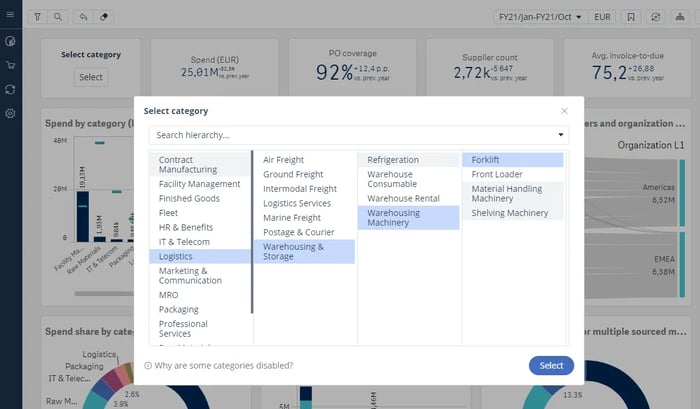
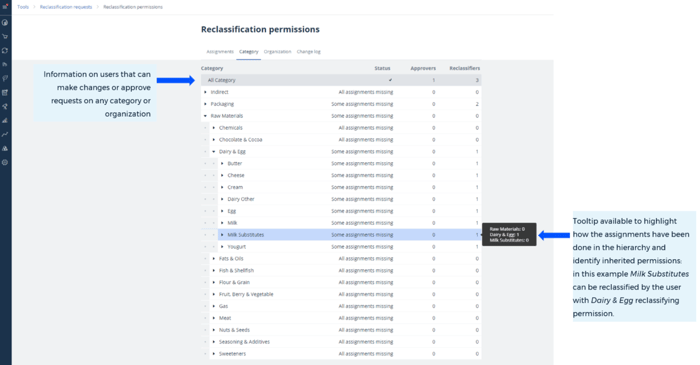
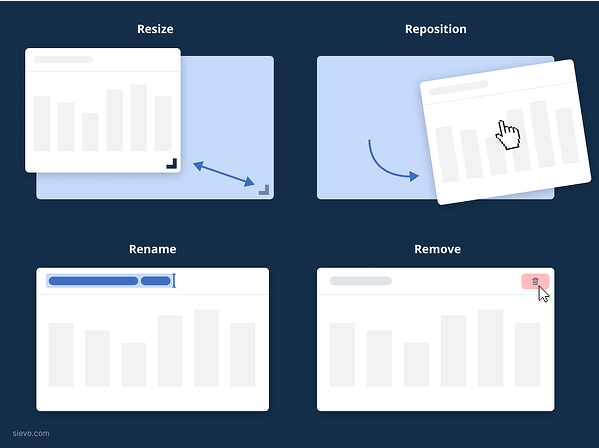
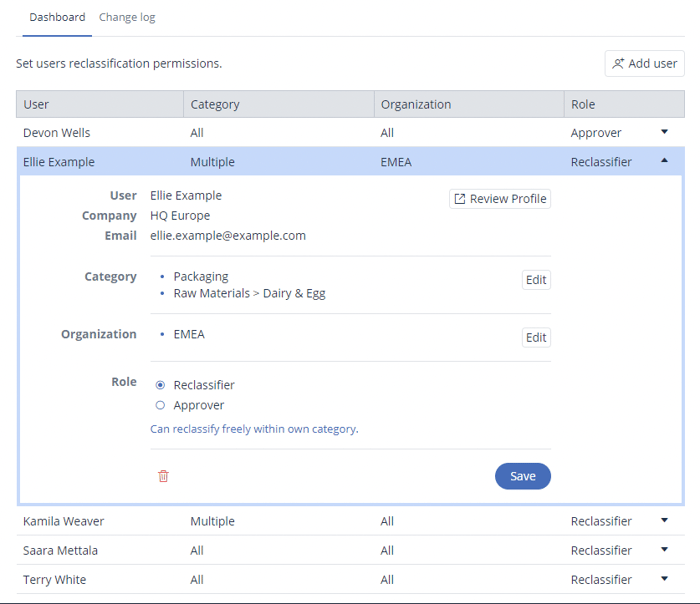
Dashboard permissions to restrict visibility and improve usability
We’ve received a lot of requests to restrict the view of certain dashboards to a particular group of users. Well, now you can! With help of dashboard permissions, user access to Analytics dashboards can be easily controlled and restricted when needed. The permissions enable creation of multiple permission groups with varying access rights. This also enables restricting access to certain dashboard within one Sievo solution area e.g. Spend instead of only restricting access to full solution area.
Your Sievo contact person will help set up the access groups, whereafter Sievo Super users can freely manage the access rights of individual users.
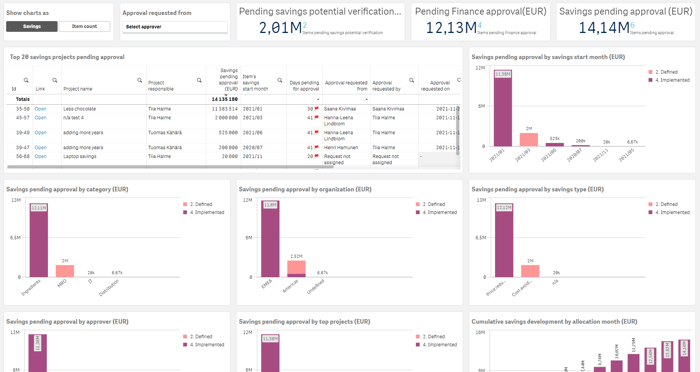
Savings program management
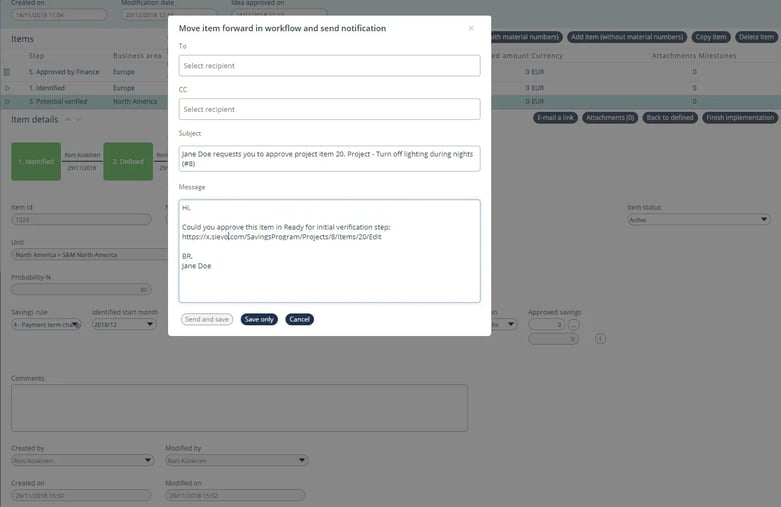
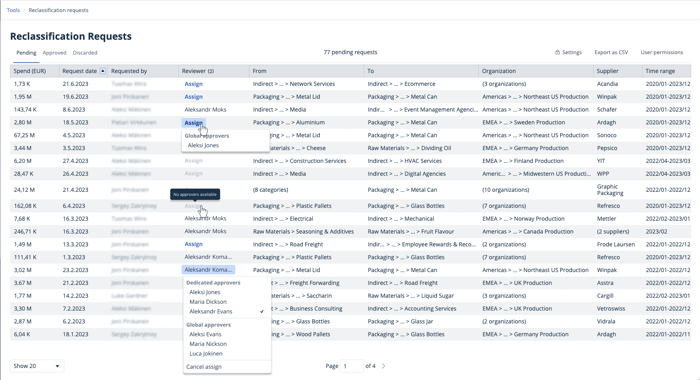
Title and organization added to notification recipient list
Finding the correct approver for your project is sometimes tricky in large organizations. We have now made it easier, by adding job title and the organization of your colleagues, to the notifications recipient view. You can also search for the title and organisation, if you are unsure of the recipients name.
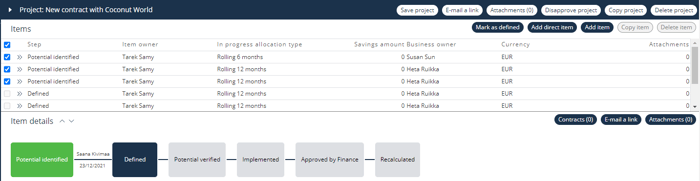
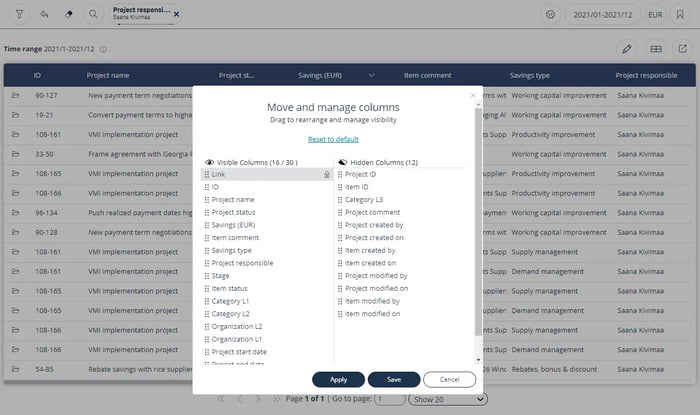
All project stages in one glance
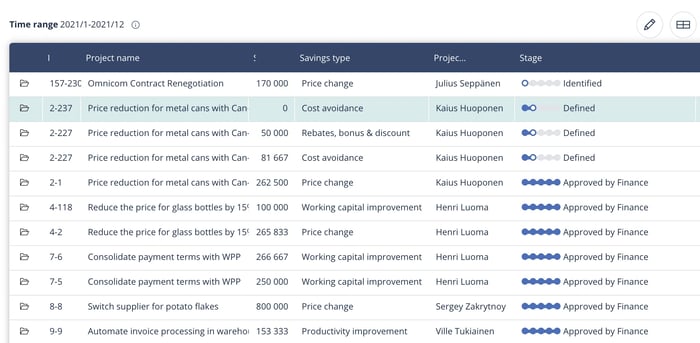
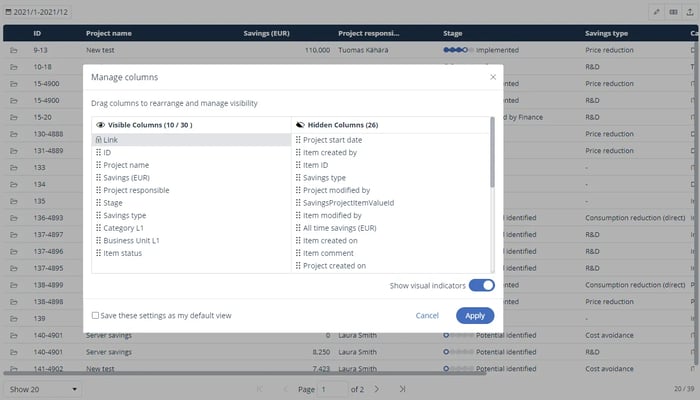
We have added a visual workflow to the project list, helping you to get an overview of your projects’ stage. The visual workflow helps you see each project stage, in one glance. Use the top right list settings, to manage what columns you see in the list, and toggle the visuals on and off.
In-document search for attached contract documents
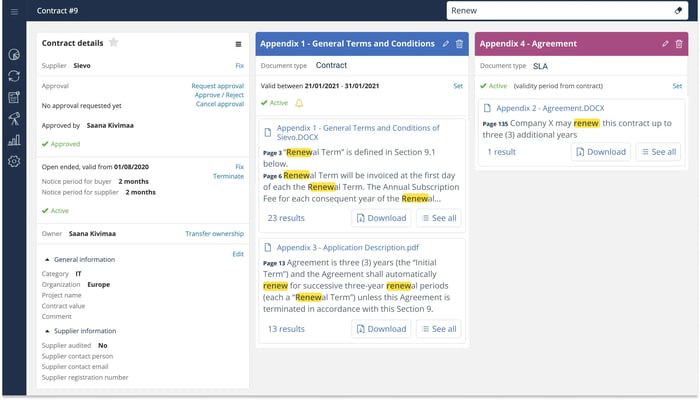
You can now search for text within the attached contract documents, using the new free-text search functionality. You’ll find the search in the top right corner of a individual contract. This will make it a whole lot easier for you to manage your contract documents and find details of the contract without opening each attached document separately. Search works with the most common document types, including scanned PDFs and even images, as we utilize optical character recognition when indexing the documents.
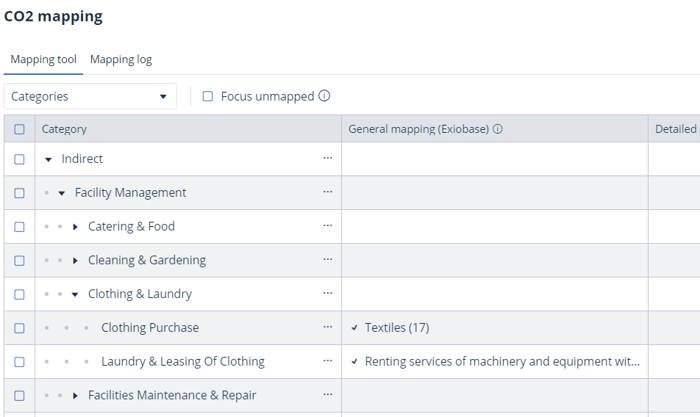
Supporting multiple data sources for your contracts
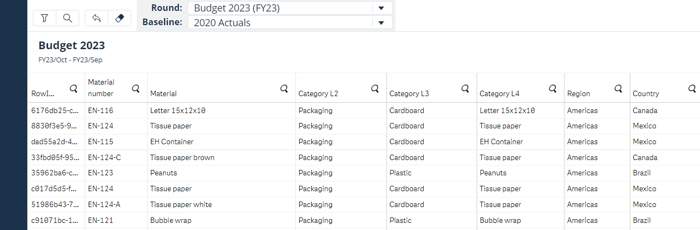
We now support multiple data sources in our contract analytics. No matter what system you are using to manage your contracts, we want to provide a unified contract analytics experience and help you to combine your contract data with spend. With the contract dashboards, you’ll get a view on your contract coverage and expiring contracts. With self-service you can take a closer look at the contract details.
General features
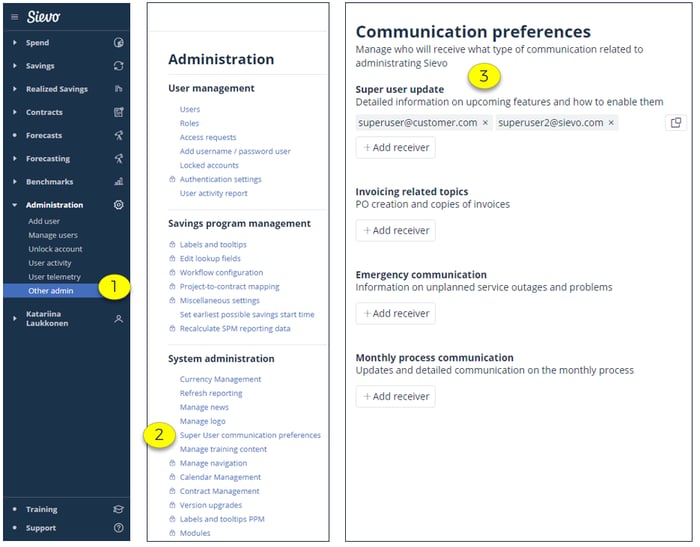
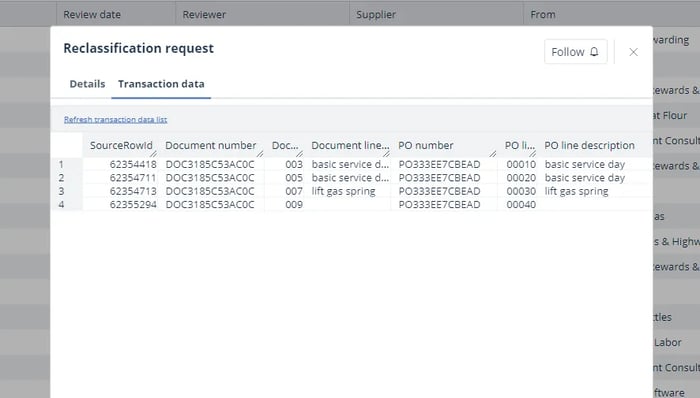
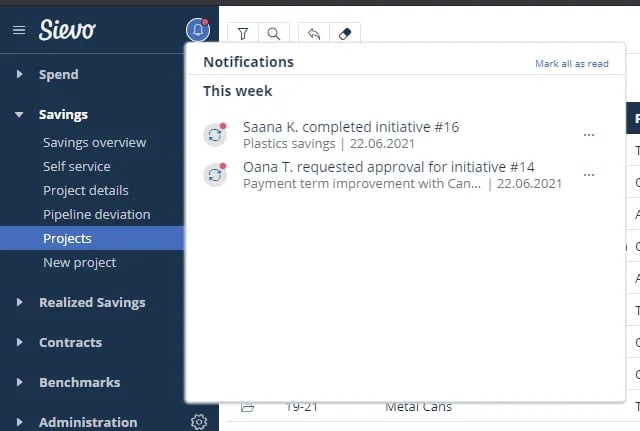
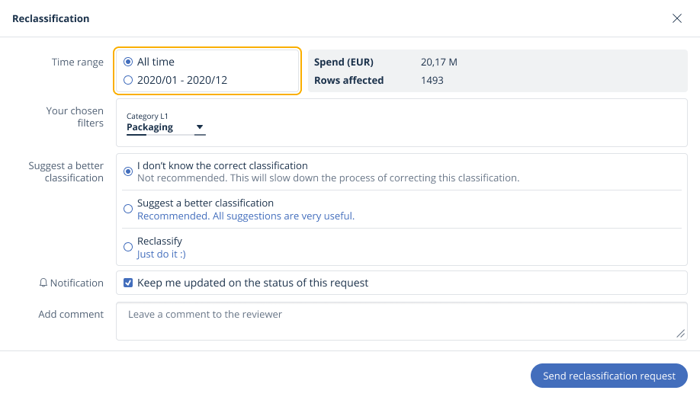
Notifications in Sievo
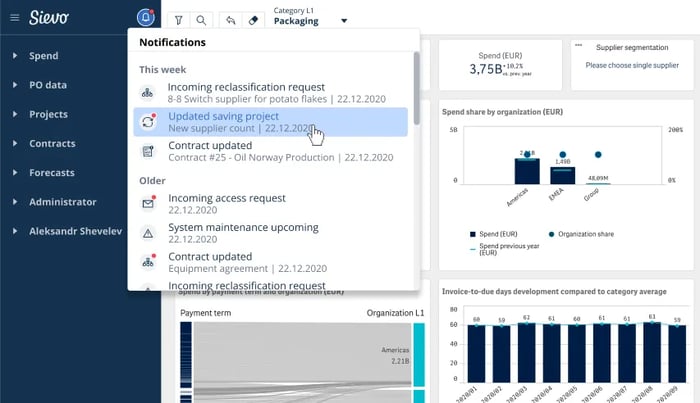
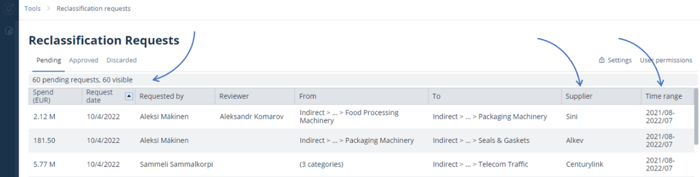
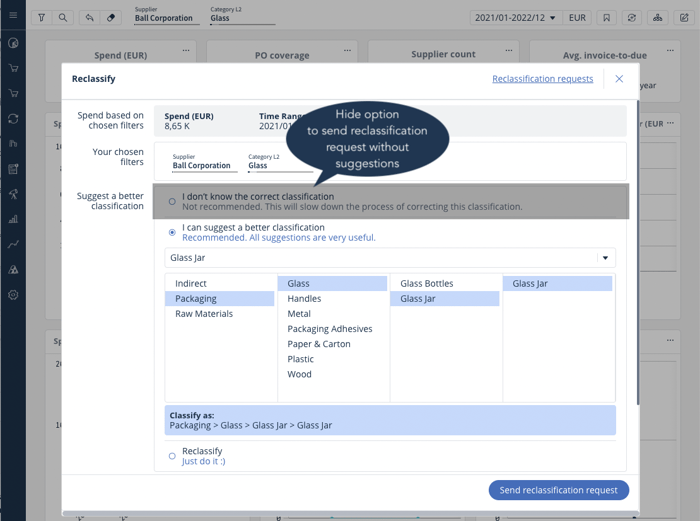
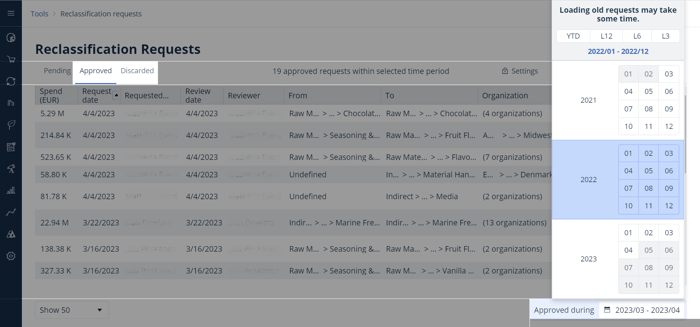
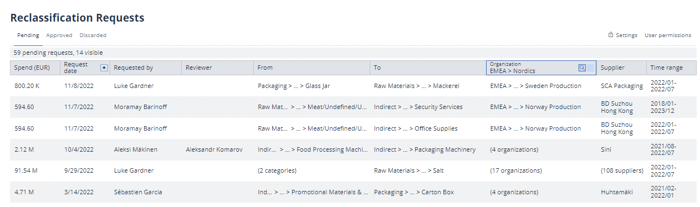
You will soon start receiving notifications in Sievo, to help you keep track of things like savings projects, expiring contracts and reclassification requests. The notification bell icon will appear on top of your main navigation when you receive your first notification. We will be adding many more notifications, so please let us know what you would like to be notified of using this form.
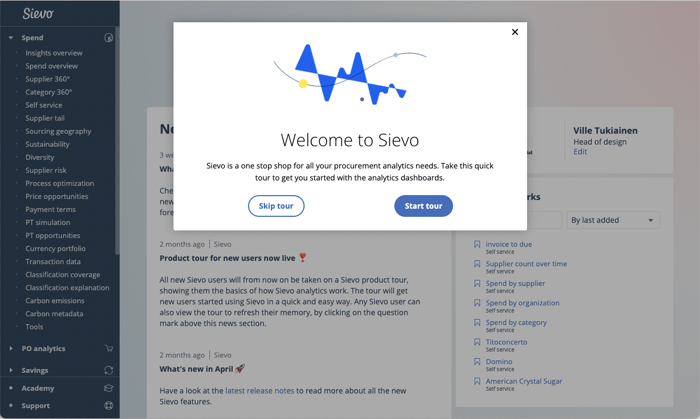
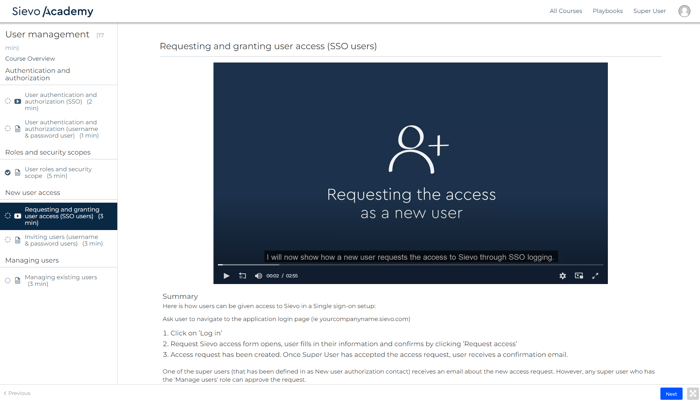
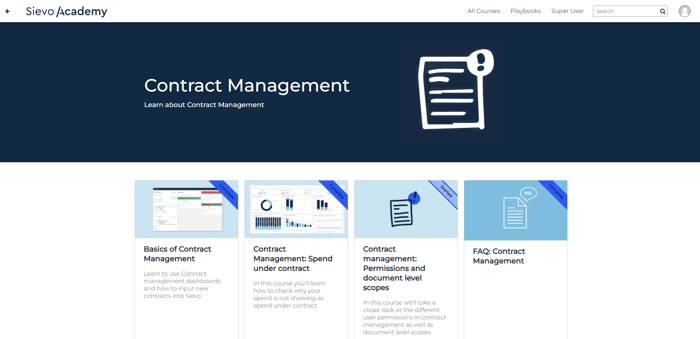
Sievo Academy
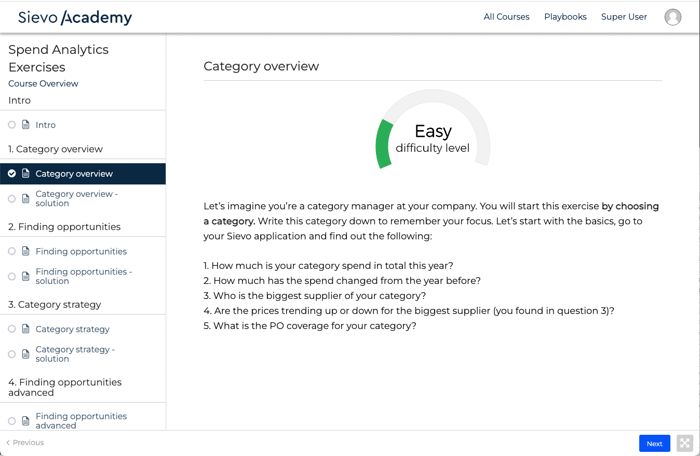
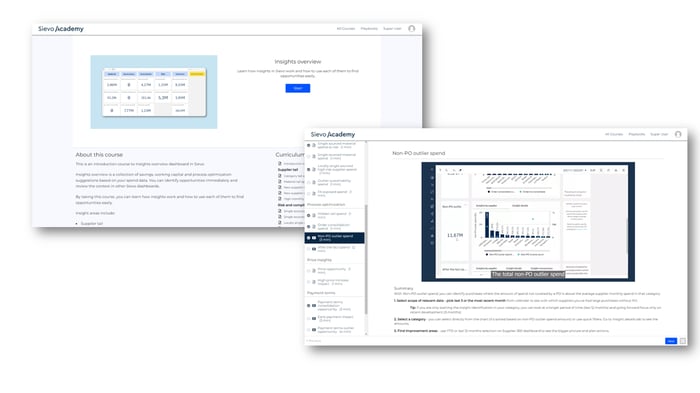
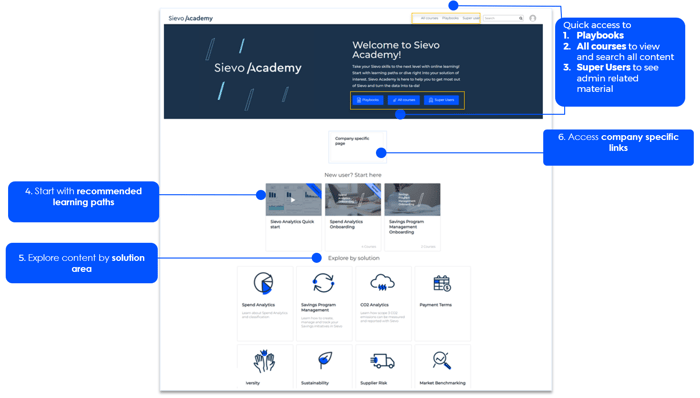
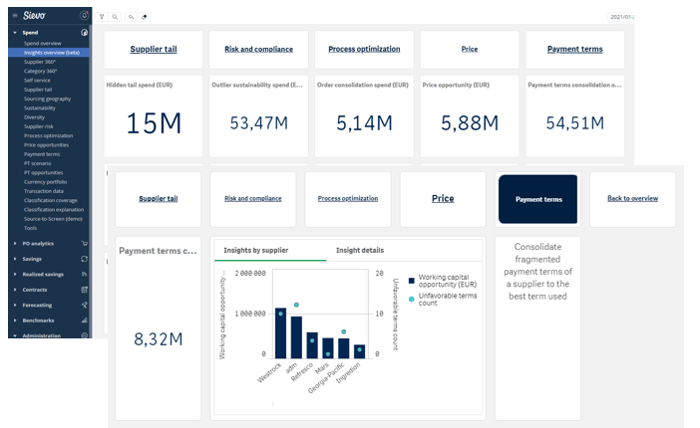
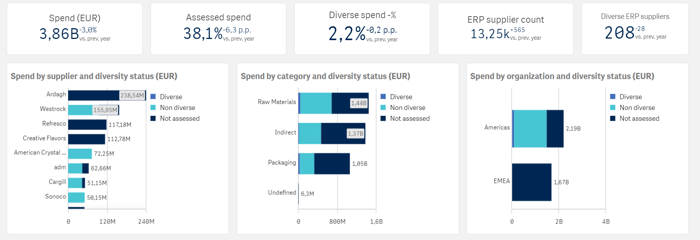
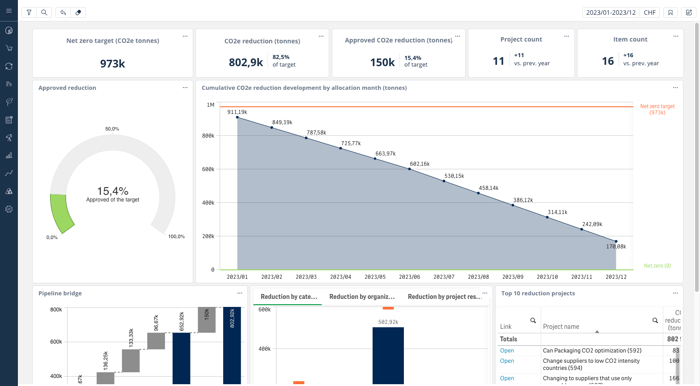
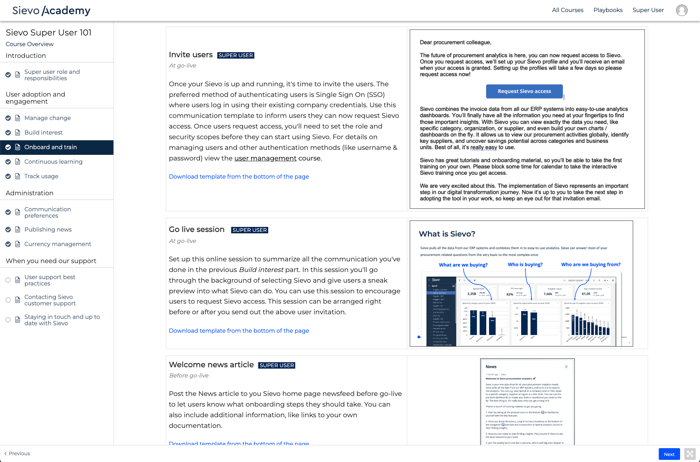
New learning videos added!
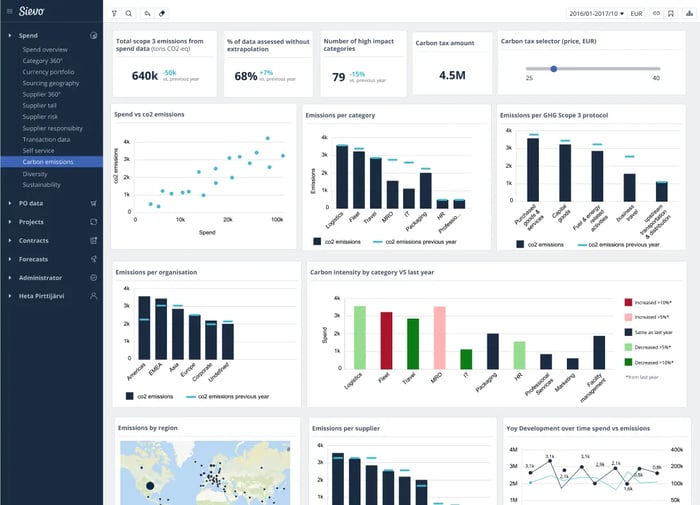
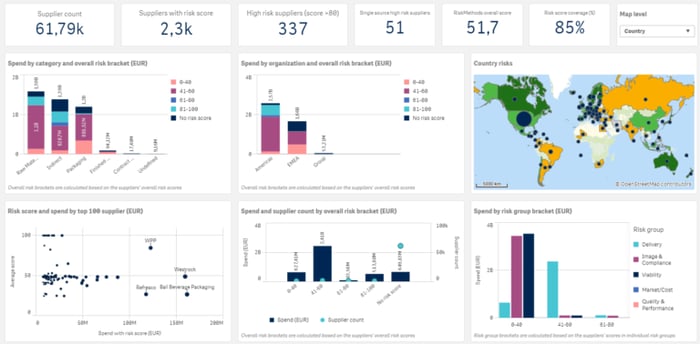
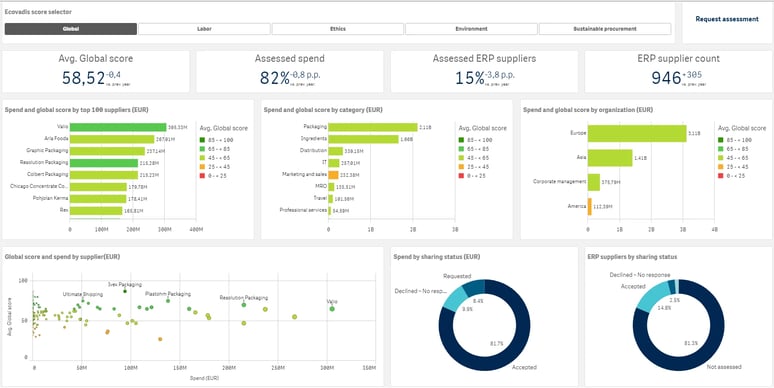
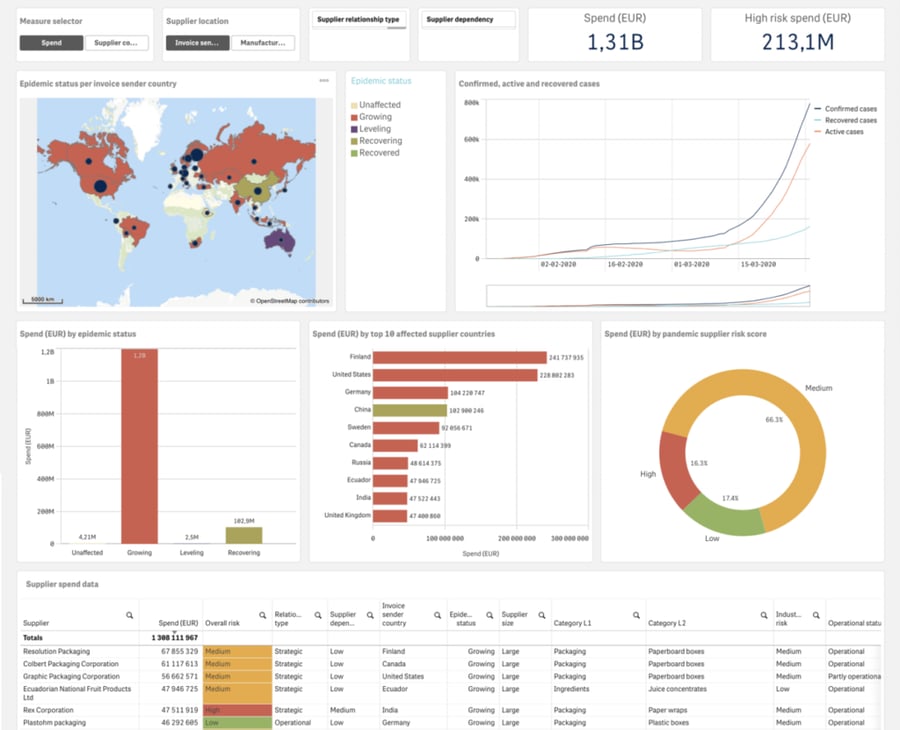
We have added new content to the training section, including the often desired ‘What is spend in Sievo?’ – video, which explains you what data is used in Sievo Spend Analysis and why it might be different than in your ERP systems. We’ve also added a training video on the Supplier Risk dashboard. Check it out to fine tune your skills on using the dashboard, see the high-level picture of the risk distribution, as well as taking actions to find alternative suppliers with favourable risk scores for your current high risk suppliers.
%20(2)-png.png?width=700&height=374&name=Screenshot%202022-11-03%20at%2011-07-01%20(3)%20(2)-png.png)