Procurement ROI and Operational Procurement Performance
Procurement is eager to measure others performance, but what about procurement return on investment? Learn how to measure procurement cycle times and ROI.
Tell Me MoreUpdated: Jan 15, 2025
Procurement performance measurement (PPM) is the systematic process of measuring the effectiveness, efficiency, and spend of procurement teams with the continuous ambition of improving the value of procurement to business.
Selecting the most relevant Procurement Key Performance Indicators (KPIs) depends on business strategy, organizational structure, size, location of the business, and budget.
The metrics most widely tracked to measure procurement performance are cost savings, operational KPIs, spend under management, supplier performance, employee deliverables, and costs.
Such procurement performance measures can include procurement cycle time, compliance rate, material defect rate, material availability, rate of emergency orders, procurement service level, customer satisfaction, PO or invoice accuracy, and cost per PO or invoice.
Procurement leaders constantly look for ways to improve the procurement performance of people and processes to demonstrate value to the business and stakeholders.
This blog post will walk you through measuring and systematically improving your procurement performance and calculating your Procurement ROI.
Why should you monitor procurement performance?
Procurement performance measurement is essential because of procurement's role in the company's financial performance, quality, resilience, and risk management.
By measuring the efficiency of their processes, organizations can establish to what extent there are fulfilling their mandate. Managing procurement performance can provide the following benefits:
- Improved management of the team
- Effective allocation of resources
- Improved productivity and steering of performance
- Greater strategic sourcing impact on business
- Ability to communicate results in numeric terms
- Demonstrating the value of procurement to business
What are operational KPIs in procurement?
Operational KPIs can provide insights into the performance of the procurement function. Operational KPIs are those that track what is happening in the day-to-day business of procurement to identify areas of improvement. Operational KPIs can help CPOs answer important questions like:
- Are our procurement processes efficient?
- How do categories compare with one another?
- How do we compare with other organizations?
- Are there bottlenecks in our processes?
- What needs to be improved in our operations?
- Are we improving or declining in our service levels?
- Are stakeholders satisfied with the speed and service delivery?
Procurement cycle times are key measures of procurement process efficiency. Cycle time tracks how long a specific task or activity takes to complete.
Better products and services can be made available sooner (alongside savings) with less time spent processing invoices, executing sourcing, or signing contracts.
Minimizing transaction time also means cost reduction. Mitigating time spent on manual activities, such as POs, PRs, and invoice management, frees up team resources to focus on strategic sourcing and development.
Procure-to-pay cycle time
The Procure-to-Pay (P2P) cycle consists of many steps, some of which are definite bottlenecks. For example, purchase order (PO) cycle time is measured in days (could be hours!) from the time a purchase requisition (PR) is submitted until the PO is sent to the supplier.
Common KPIs are time from PR to PO and the average cost-per-purchase order. One of the main bottlenecks is the delay in approving PRs. Delays may occur due to category-specific approvers’ unavailability, e.g., during unexpected leaves or overlapping responsibilities.
From a Purchase Requisition (PR) to Purchase Order (PO) 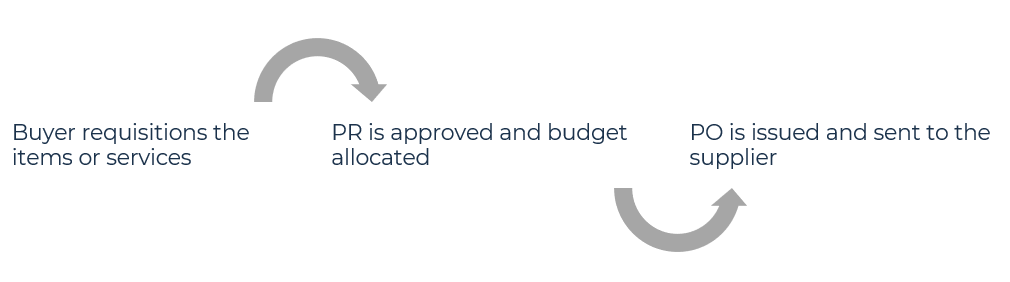
From a Purchase Order (PO) to Invoice payment
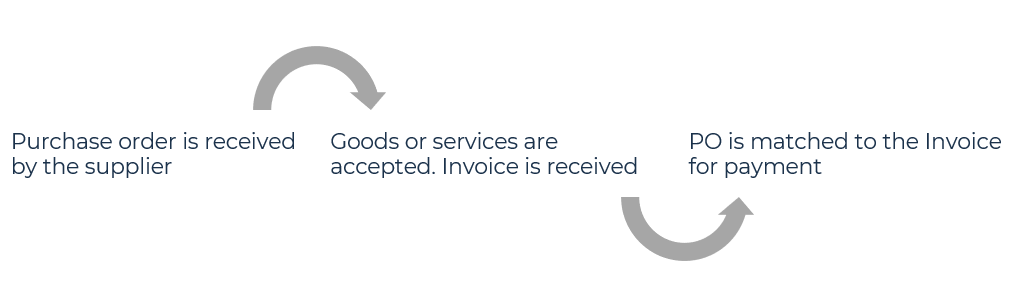
Another main bottleneck is invoice cycle time - matching the invoice to the PO, a process that can be automated. A useful KPI is PO coverage, meaning the % of invoices or spend with no PO.
Non-PO invoices require substantial manual effort and cause frustration and delays in payment if there may be no pre-approved budget to cover the invoice. The implications of slow invoice payment include missing out on discounts for prompt payments, incurring penalties for late payments, additional costs of manual handling activities, and unhappy supplier relationships.
By interrogating the payment process, a procurement organization can reduce processing time. Automating the purchase-to-pay process reduces opportunities for fraud and ensures that suppliers are paid on time with the correct price. Paper invoices should be eliminated or at least reduced to the very minimum.
The sourcing cycle time
Selecting the right KPIs for managing the sourcing process depends on the size and organization of the procurement function. In large and mid-size companies where strategic sourcing activities are conducted in category groups, one KPI may be designed to track number-of-projects-per-person.
Too many sourcing projects may lead to longer tender and RFP turnaround times or a drop in project delivery quality. Too many projects may eventually lead to a review of procurement resourcing or outsourcing some of the tender projects to specialized consultants.
An alternative way to measure tender efficiency is to calculate the average time to complete the steps in the sourcing process and the average cost of a tender.
Another KPI used to evaluate procurement impact in tenders is the difference between the first bid price and the actual price contracted.
More and more procurement organizations have started implementing performance measures for sourcing value add compared to hard KPIs.
Procurement value delivery in sourcing depends on tender project objectives and business KPIs. Sourcing value-related measures could be related to customer experience, quality, reliability, or sustainability.
How do you measure procurement ROI?
Procurement’s return on investment (ROI) determines the profitability and cost-effectiveness of the money spent on operating a procurement function. One accepted measure is:
Procurement ROI = Annual cost savings / Annual procurement cost
However, procurement value delivery is more than just cost savings. Additional procurement value is generated in strategic sourcing, category development, and supplier relationships.
One interesting perspective is seeing procurement as the driver for possible new revenue streams through supplier collaboration, innovations, and transformation of existing business models.
Value-driven alternative for measuring procurement ROI could look something like this:
Value-oriented procurement ROI =
(Annual cost savings incl. cost avoidance + Procurement value delivery incl. revenue impact) / Annual procurement cost
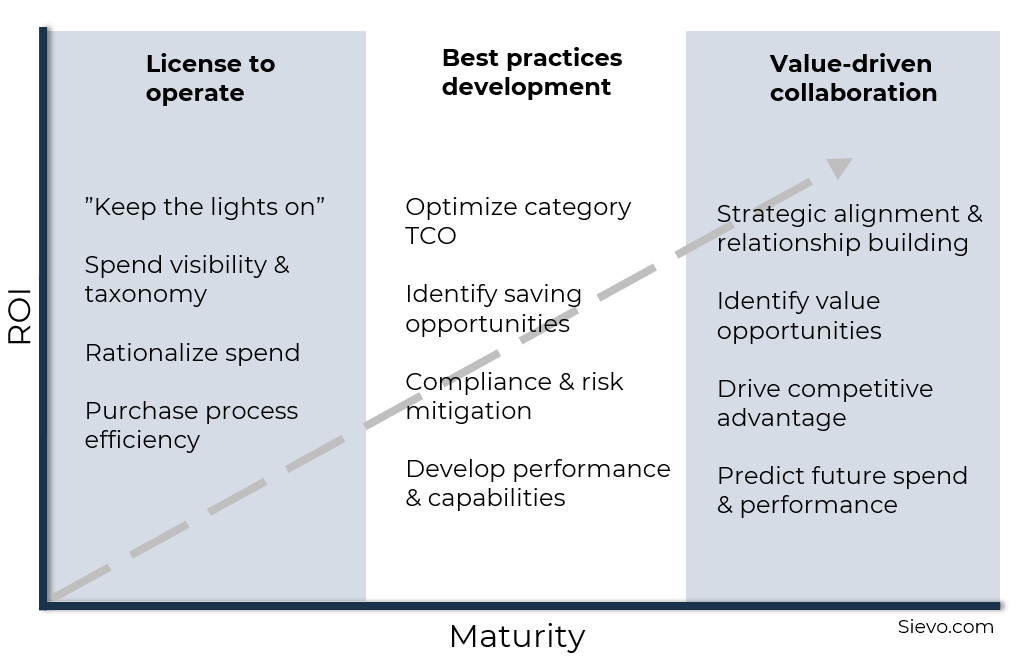
Stages of procurement maturity
The phases of procurement maturity development and increased ROI delivery follow 3 basic stages:
- having the license to operate.
- developing best practices in procurement.
- becoming a strategic partner to business and fostering value-driven collaboration.
Insights from Procurement Analytics drive organizational value
Early stages of maturity focus on ensuring a steady supply of products and services and gaining visibility on spending and categories.
Developed procurement organizations optimize their total cost of ownership (TCO) on the category level, continuously identify opportunities for savings and build their capabilities.
Mature procurement organizations drive competitive advantage, identify opportunities for value and build win-win relationships with business and category suppliers. They use spend data to assess current performance, predict future spend, and take action based on data-driven insights.
Spend analytics enables procurement performance improvement
Every company requires insights into where it is spending its money.
Spend visibility tools can highlight irregularities, process optimization potential, non-adherence to negotiated contract terms, areas not covered by PO and contracts, and excessive cycle times.
With only manual analysis methods, it is unclear who approves PRs and invoice payments and how long each transaction takes. Spend analysis provides greater visibility that is necessary for continuous improvement and tracing performance improvement opportunities back to the smallest detail.
Organizations need to make the most out of the analytical tools available to level up procurement performance. A spend analytics solution enables tracking and benchmarking of all agreed procurement KPIs from a centralized dashboard.
Performance data from all P2P processes is gathered, stored, and analyzed with minimal manual effort. Data provides a common language and understanding and a starting point for improvement.
Cover picture by Hert Niks (unsplash.com)

Related Articles