Updated: May 28, 2026
What is Procurement Analytics?
Procurement analytics is the process of collecting and analyzing procurement data to gain business insights and inform decision-making. Procurement analytics involves collecting, classifying, and analyzing procurement data from multiple sources, such as ERPs and other systems. The data is then transformed into actionable insights, presented through visualization dashboards or business intelligence tools, to support future-proof procurement strategies.
How it differs from traditional procurement reporting:
-
From manual to automated: Traditional reporting is often reactive and time-consuming. Analytics can be automated and updated in near real time.
-
From siloed to connected: Data isn't trapped in departments. Analytics integrates sources across regions, categories, and teams.
-
From what happened to what's next: Analytics goes beyond reporting the past; it helps forecast risks, savings opportunities, and supplier performance.
In short, Procurement analytics turns procurement data into an actionable resource.
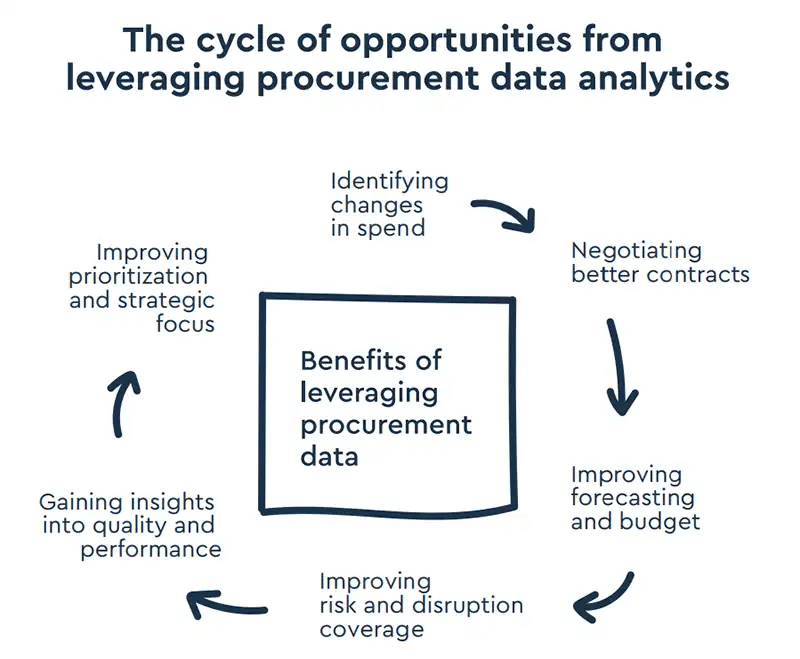
Benefits of Procurement Analytics
Procurement analytics helps organizations move beyond gut-feel decision-making by turning raw purchasing data into clear, trusted insights. All functions, from marketing to finance, can benefit from procurement data and its broad range of insights.
1. Builds Trust Through Data You Can Stand Behind
When procurement data is consistent, complete, and trustworthy, it serves as a shared foundation for informed decision-making across the business. Teams can align on facts instead of assumptions, whether discussing spend trends, supplier risks, or sourcing opportunities.
High-quality analytics depend on clean, well-classified data from across systems. With providers like Sievo, this process is fully handled from extraction to harmonization, regardless of system complexity.
2. Reduces Manual Effort
Many procurement teams still spend time manually classifying spend, chasing down invoice errors, or maintaining reports. With automation, these repetitive tasks can be offloaded, giving teams more time for value-driving work like supplier negotiations, risk analysis, or category strategy.
Analytics should adapt to users, not the other way around, so that insights are accessible without requiring deep technical skills or IT support.
3. Supports More Informed Decisions
Procurement analytics enables organizations to act on a wider range of business goals, not just cost savings. Examples include:
-
Improving forecasting and budget planning
-
Identifying supplier risk and market exposure
-
Tracking ESG and sustainability performance
-
Managing supplier diversity and inclusion
-
Benchmarking performance across categories and regions
When analytics combines internal data with trusted external sources, it provides the context needed to make well-rounded decisions.
4. Scales with Organizational Complexity
As procurement operations expand across multiple business units, regions, and systems, the complexity of managing data increases. Procurement analytics can keep pace, providing visibility without adding operational overhead.
Key capabilities include:
-
Connecting with diverse and complex source systems
-
Accommodating custom taxonomies and local processes
-
Delivering insights across teams without heavy onboarding
-
Keeping data current with continuous updates
With the right setup, procurement analytics can scale alongside your organization, without scaling the workload.
Types of Procurement Analysis
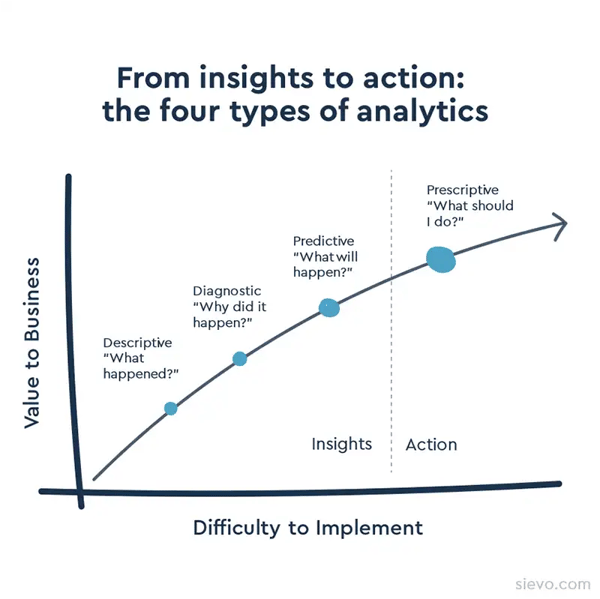
The field of procurement analytics has emerged from the need to understand past performance and guide future decision-making. Common types of analysis in procurement include:
Descriptive Analytics
Focuses on what has happened. It summarizes historical procurement data, including spend totals and contract usage, to provide a clear picture of past activity.
Diagnostic Analytics
Explains why something happened. This analysis looks for underlying causes in procurement outcomes, such as delays, overspending, or supplier performance issues.
Predictive Analytics
Anticipates what is likely to happen next. It utilizes trends, patterns, and historical data to forecast future outcomes, such as price changes, supply risks, or demand shifts.
Prescriptive Analytics
Recommends what actions to take. Building on predictive insights enables optimized decisions, such as adjusting sourcing strategies or renegotiating contracts.
The Evolution of Spend Analytics
Procurement analytics has traditionally focused on reviewing historical spend and supplier performance. As capabilities have matured, the emphasis has shifted toward AI, automation, prediction, and prescriptive decision-making, where data doesn't just describe the past, but actively informs what to do next.
Over time, procurement analytics solutions have evolved through four distinct generations:
-
Generation 1 (1990–2000): Manual Spreadsheet Analysis
Procurement data was analyzed using Excel by consultants or analysts. The focus was on retrospective spend analysis, which was often siloed and time-consuming. -
Generation 2 (2000–2010): Desktop Software
Organizations began using licensed software installed behind the firewall. These tools centralized procurement data but lacked real-time visibility or integration. -
Generation 3 (2010–2015): SaaS-Based Dashboards
Browser-accessible analytics tools introduced data visualization and better usability. These were often delivered as Software-as-a-Service (SaaS), enabling wider access and simplified deployment. -
Generation 4 (2015–Today): AI-Powered, Cloud-Native Platforms
The latest generation integrates multiple internal and external data sources, automates classification, and delivers real-time, predictive, and prescriptive insights. These solutions are cloud-hosted, encrypted, and continuously refreshed.
Different generations still co-exist depending on an organization's size, maturity, and infrastructure. Some procurement teams rely on Excel or internal BI tools, while others use fully automated analytics platforms.
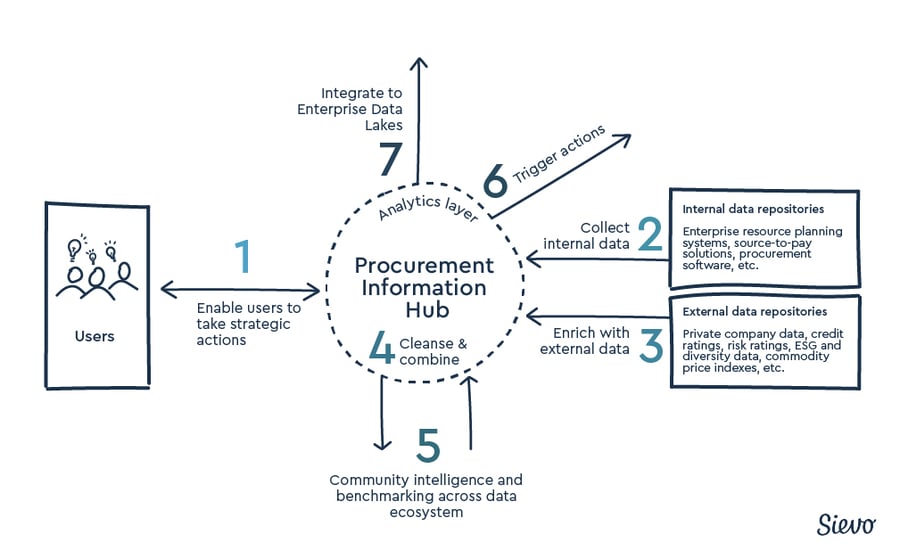
Critically, modern procurement analytics is no longer just about dashboards. It's about creating a centralized procurement information hub—a single, enriched source of truth that connects data from across systems and unlocks insights that drive action.
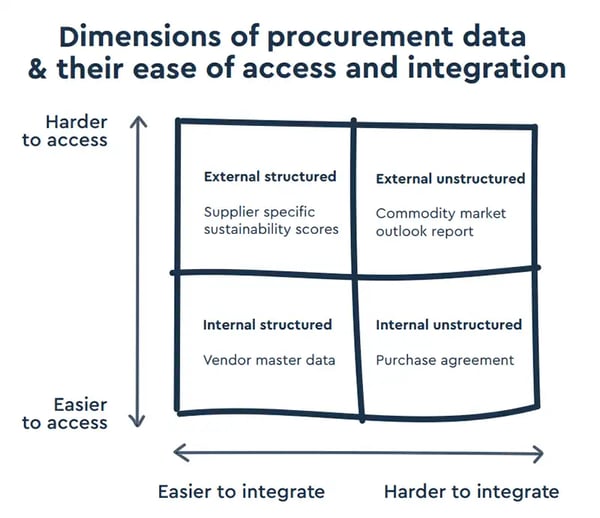
Sources of Procurement Data
Procurement organizations often face the challenge of heterogeneous data landscapes. As many businesses are formed from more than one business unit, financial processes may vary on a regional or international basis or across businesses.
Increasingly, procurement analysts are starting to leverage data from outside of their own procurement organizations, combining the most valuable aspects of internal and external data.
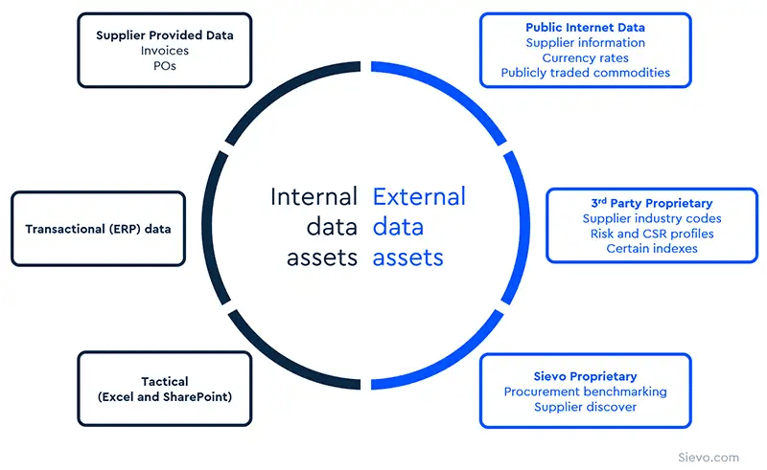
Internal Procurement Data
Internal data comes from systems the company owns or operates. This includes:
-
ERP platforms, accounting systems, and procurement software
-
General ledger records, supplier databases, and purchase order logs
-
Spreadsheets or ad hoc reports shared across departments or regions
This data reflects actual purchasing activity but often requires cleansing, normalization, and integration across systems before it's ready for analysis.
External Procurement Data
External data provides context that internal systems alone can't offer. These sources help procurement teams benchmark performance, assess market conditions, and understand supplier-related risks.
Examples of external data sources include:
-
Public datasets, such as commodity prices, currency rates, or supplier registrations
-
Third-party sources, including credit ratings, ESG scores, and industry classifications
One example of community-based data is Sievo Community Data, which compiles transaction-level procurement information from a wide network of enterprises. Because it’s based on validated spend data rather than surveys or estimates, community data models like this offer a more grounded basis for comparison and forecasting. This type of data can support:
-
Payment term benchmarking, segmented by supplier type, region, or category
-
Price trend tracking, particularly in categories without transparent market pricing
-
Supplier discovery, using shared sourcing patterns across industries
Examples of analytics in procurement
Procurement analytics covers a wide range of applications, each designed to extract specific insights from different stages of the procurement process.
Below are commonly used analytics types, categorized by their core focus:
Spend analytics: the analysis of procurement spend data from internal or external data sources.
Invoice analytics: the analysis of invoice data and payment cycles from internal or external data sources.
Purchase order analytics: the analysis of purchase order (PO) coverage, maverick spend, and PO cycle times from internal or external data sources.
Payment term analytics: analysis used to identify and act on working capital improvement opportunities.
Supplier analytics: the analysis of individual suppliers’ performance, comparison of supplier performance, analysis of supplier risk, sustainability or diversity, or analysis of supplier base.
Diversity analytics: the analysis of social responsibility and diversity in the supply base, on category and individual supplier level.
Sustainability analytics: the analysis of Environmental, Labor & Human Rights, Ethics, and Sustainable Procurement targets from your supply chain.
Supplier risk analytics: analysis of external risk factors negatively impacting your supply chain.
Contract analytics: the analysis of supplier contracts and their meta-data, such as payment terms and expiration dates.
Market benchmarking: assess risk and discover opportunities by benchmarking your purchase prices against market price development.
Savings lifecycle analytics: the analysis of savings projects and their impact on the financial bottom-line.
CO2 analytics: the analysis of scope 1, scope 2, and scope 3 emissions.
Spend forecasting: the forward-looking analysis of procurement spend data and its impact on profitability.
Use Cases of Procurement Analytics
Procurement analytics is often misunderstood as just spend tracking. In reality, it supports decision-making at every stage of the procurement process, from strategy and sourcing to contracts and compliance.
The impact stretches beyond cost savings, shaping how organizations manage risk, sustainability, and supplier performance.
Below are practical ways analytics supports core procurement functions.
Analytics in Category Management
When effectively used, analytics give category managers superpowers.
-
Identify untapped savings by analyzing category-level spend trends
-
Segment suppliers based on performance, risk, and strategic value
-
Monitor sustainability and diversity metrics within supplier groups
-
Benchmark historical pricing or supplier terms
Blog: Introduction to category management | Definitions and best practices
Analytics in Strategic Sourcing
Analytics supports more informed sourcing decisions by providing historical, operational, and market-level context.
-
Flag expiring, inactive, or underutilized agreements
-
Detect off-contract purchases and gaps in compliance
-
Compare contract terms to actual purchasing behavior
-
Standardize savings tracking from negotiated terms to realized results
Blog: Leveraging spend analytics in strategic sourcing
Analytics in Contract Management
Analytics provide value across contract lifecycle management.
-
Flag contracts that are underused, expiring, or off-track
-
Identify off-contract purchases or policy violations
-
Compare agreed terms with real-world outcomes
Blog: 7 tips to reduce maverick spend in procurement
Analytics in source-to-pay (S2P) process
Procurement analytics can also provide much value in the transactional side of procurement.
-
Monitor PO and invoice cycle times
-
Catch duplicate invoices, overpayments, or missed rebate opportunities
-
Evaluate payment terms and their impact on working capital
Blog: How PO analytics fuel P2P performance: insights from a best-of-breed
Analytics in sustainability and corporate social responsibility (CSR)
Environmental and social metrics are increasingly part of supplier evaluations. Analytics brings structure and traceability to ESG reporting.
-
Measure emissions, labor practices, and ethical sourcing indicators
-
Highlight sustainability risks in specific regions or categories
-
Support ESG initiatives with supplier-level data
-
Support non-financial performance goals with the same discipline as cost targets
Blog: What is sustainable procurement and why is it important?
Analytics in risk management
Procurement-related risk is constantly shifting. Analytics helps make that complexity manageable.
-
Track supplier financial health, geopolitical exposure, or delivery reliability
-
Map concentration risks and identify single-source dependencies
-
Inform contingency planning with data that updates over time
Blog: 3 ways to tackle commodity price fluctuations and volatility
Analytics in performance measurement
Procurement teams are expected to show results. Analytics makes it easier to define, measure, and communicate their contribution.
- Track cost savings, cost avoidance, and realized value over time
-
Measure initiative progress against baselines
-
Standardize savings logic across teams and systems
-
Provide transparent reporting to finance and stakeholders
-
Align procurement metrics with finance, ESG, and strategic goals
Blog: Everything you need to know about Procurement savings
Business Cases for Procurement Analytics
Procurement analytics has the potential to improve operational efficiency across the entire sourcing and supplier management lifecycle. Common business objectives for procurement analytics include:
Key business objectives addressed by procurement analytics:
-
Cost reduction: Identify savings opportunities and track realized financial impact.
-
ESG and supplier diversity: Monitor emissions, ethical sourcing, and diversity metrics.
-
Risk mitigation: Detect supplier disruptions and market exposure early.
-
Sourcing optimization: Use historical data to refine supplier and category strategies.
-
Cash flow improvement: Optimize payment terms, invoice cycles, and FX exposure.
-
Opportunity discovery: Uncover new markets, innovations, or supplier value through data.
Many organizations recognize that procurement is a critical business contributor. Typically, 40 – 70% of all costs are procurement-related, and these costs are often a source of competitive advantage.
Adopting procurement analytics tools has demonstrated a return on investment (ROI) of up to 63x, particularly in large-scale or high-complexity environments.
How to Know If You Need Procurement Analytics
The common goal of most procurement analysis solutions is to be a single source of truth where procurement teams can make informed decisions with data they can trust.
While most procurement organizations share similar aims for reliable data visibility, they all face unique resources and challenges in achieving this goal.
You can assess the complexity of your needs on four key dimensions:
-
Connectivity - do you need to bring together multiple sources of data from within and outside of your procurement organization?
-
Adaptability - can the solution fit into your team’s sourcing processes, culture, organization structure and workflows?
-
Transparency - do you need to see and understand how spend is organized? Can you trust the data?
-
Speed - how often do you require updated analysis and how actively is it used in your organization?
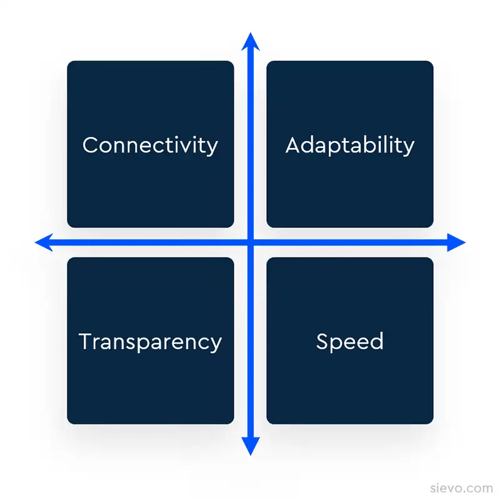
Scoring high across these dimensions signals an opportunity to unlock greater visibility, faster decisions, and measurable savings by implementing a dedicated procurement analytics platform.
If you don't require many connections between different source systems and a high level of transparency in the analysis process, you may be able to start with a one-time analysis done in Excel or with help from a consulting partner.
But if you're managing global suppliers, operating across multiple systems, or need continuously updated data, investing in procurement analytics software creates a clear advantage.
Procurement KPIs and Metrics
Procurement metrics or key performance indicators (KPIs) provide organizations with quantifiable values to measure performance and guide procurement strategies. Metrics can also be used to benchmark procurement's performance to peers or to prove contribution to company-wide goals and targets.
One challenge with procurement metrics is that they may be used inconsistently or have different meanings for key stakeholders, such as finance. When standardized, they help clarify the role and performance of procurement within the wider organization.
Below is a focused breakdown of the most widely used procurement metrics—and what each actually tells you.
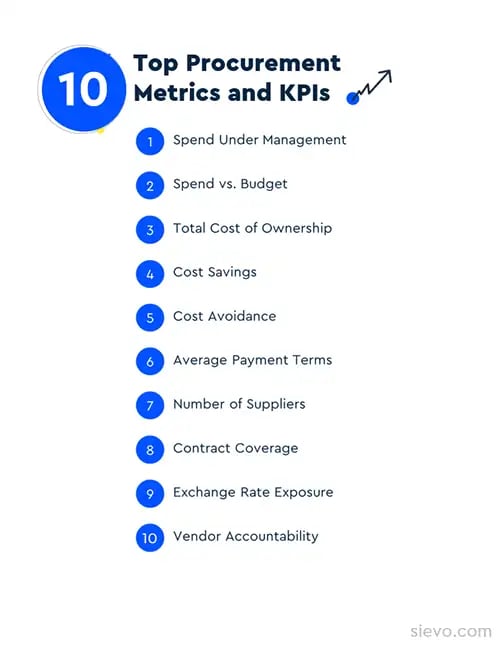
1. Spend Under Management
Spend under management is the total amount of spend that is actively managed by the procurement organization. This figure can include every region and category that procurement is working with, or can be divided into separate metrics that represent a specific region or category.
Spend under management is a crucial metric for a procurement organization, as it reflects maturity and control over spending.
2. Spend vs. Budget
Spend vs. budget tracks the actual spend in procurement and compares it to the overall budgeted spend or the budgeted spend per business unit.
Tracking realized spend against budgets is the foundation of spend management and ensures alignment with key stakeholders such as finance.
When evaluating spend vs. budget, success is not necessarily measured by a decrease in cost but by budgeting accuracy.
3. Total Cost of Ownership
Total cost of ownership (TCO) refers to the cumulative cost of all expenditures. TCO takes into account every cost incurred during the procurement phase, including all direct and indirect costs associated with a product or system.
It’s not limited to just the purchase price but includes transaction fees, warehousing, and other incidental costs.
TCO is a valuable metric for procurement because it provides a cost basis for the total economic value of an investment.
4. Cost Savings
Cost savings are measured by the cumulative amount of savings gained. These are then categorized for focused measurement. They are followed over a time period to see how cost-saving targets are met.
5. Cost Avoidance
Cost avoidance refers to any actions that help a company avoid incurring inevitable additional costs. These costs may be due to inflation, shorter payment terms, exchange rate fluctuations, or requirements for additional features or services, among other factors.
Cost avoidance will not be reflected in budget or financial statements but can be used as a measure of procurement performance.
6. Average Payment Terms
Average payment terms measure the average time (in days) it takes to pay invoices, calculated using every instance of payment term information. Improving or harmonizing payment terms among and within suppliers is a key way of improving working capital.
While the improvement in working capital will not be reflected in financial statements, you can calculate savings based on proxies such as the cost of borrowing.
7. Number of Suppliers
The number of suppliers indicates the number of distinct suppliers utilized in the procurement organization or in a specific category.
Reducing the number of overlapping suppliers in a category can lead to efficiencies and cost savings. Increasing the number of suppliers in key categories can be advantageous in reducing supply risk.
8. Contract Coverage
Contract coverage measures the amount of spend that is covered by a contract. In contrast, maverick buying highlights the potential loss of value that can occur when purchasing off-contract.
Increasing the amount of spend that is covered by contracts (or procurement-approved purchase orders) can result in savings while also reducing compliance risk.
9. Exchange Rate Exposure
Exchange rate exposure quantifies the changes that currency fluctuations and conversions have on the overall spend. The long-term impact of exchange rates can be measured and isolated from the realized savings measurement.
10. Vendor Accountability
Vendor accountability measures suppliers' performance and their responsibility for handling errors and claims. Examples of vendor performance measurement include defect rate, lead time, and the cumulative amount of incidents per supplier.
The goal of vendor accountability is to ensure that the overall best product or service is delivered, and to develop more strategic supplier relationships.
KPIs and the Balanced Scorecard for Procurement
The Balanced Scorecard (BSC), developed by Kaplan and Norton, is a strategic management framework that connects performance metrics to business goals across four key dimensions: financial outcomes, stakeholder value, process efficiency, and organizational learning and growth.
Procurement analytics plays a critical role in making the Balanced Scorecard functional, not just theoretical. It powers the consistent, accurate, and real-time measurement of KPIs needed to align procurement efforts with business strategy.
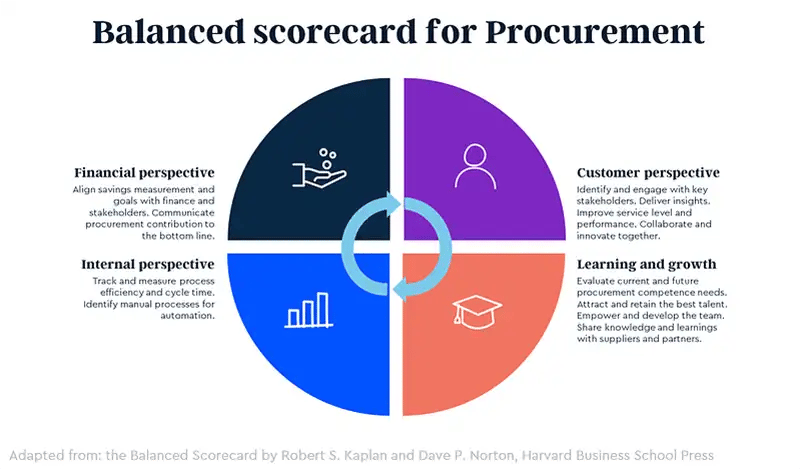
While there are some industry-level best practices, each company is likely to have its own scorecard of metrics related to its own business goals. In the balanced scorecard model the key focus areas to include are:
1. Financial Performance
Metrics like cost savings, cost avoidance, and spend under management directly reflect procurement's impact on margins and working capital. These KPIs must be measurable and align with finance's reporting standards.
2. Internal Stakeholder Value
While procurement doesn’t serve external customers, satisfaction among internal teams (e.g., finance, operations, legal) matters. Useful metrics include stakeholder satisfaction scores, request-to-order cycle time, or sourcing lead time.
3. Process Efficiency
This dimension measures how effectively procurement executes actions, such as contract compliance rate, touchless PO percentage, or average payment terms. These metrics highlight automation, accuracy, and throughput.
4. Capability and Learning
Covers procurement team development, knowledge management, and innovation adoption. Metrics might include training hours per employee, category manager tenure, or AI adoption in sourcing decisions.
Without analytics, scorecards often rely on manually maintained KPIs. Procurement analytics systems automate data collection, reduce reporting lag, and increase trust in the numbers. This allows teams to move beyond performance monitoring into proactive optimization.
Procurement analytics solves many of the reasons why scorecards become ineffective:
- If metrics lack context, analytics provides visibility into the reasons behind KPI trends, not just the what.
- If too many KPIs dilute focus, dashboards prioritize high-impact metrics tied to current goals.
- If targets aren't data-backed, procurement analytics enables realistic benchmarking based on historical trends and peer data.
Procurement Analytics Solutions
Procurement teams today must decide whether to build internal reporting systems or invest in dedicated analytics software.
This decision impacts not just reporting workflows, but also data reliability, insight accuracy, and scalability across the organization.
Let’s go through the benefits and limitations of each option.
BI Tools in Procurement Analytics
Business intelligence platforms like Power BI or Tableau are often the gateway to procurement analytics due to existing licenses and internal familiarity.
These tools allow teams to perform descriptive analysis such as identifying top suppliers, tracking category-level spend, or comparing year-over-year procurement trends.
Benefits of BI Tools for Procurement Use Cases
-
Low barrier to entry: Often already licensed, no extra onboarding needed.
-
Good for simple setups: Works well when data comes from a single ERP or system.
-
Ideal for ad hoc reporting: Suits one-time analysis, pilots, or early experimentation.
-
Fits enterprise BI strategy: Easily integrates with org-wide dashboards and reporting tools.
-
Cost-efficient at small scale: Uses existing resources without new platform costs.
Limitations of BI Tools for Procurement Use Cases
BI tools are general-purpose, they weren’t built with procurement in mind. Procurement data typically comes from multiple ERP systems, supplier portals, and external sources, and must be cleaned, categorized, and contextualized before it can be used effectively.
Challenges include:
-
Outdated insights: Static exports often result in data that is outdated by the time it's used.
-
Manual upkeep: Cleansing, categorization, and enrichment require constant rework.
-
No procurement logic: Lacks built-in understanding of maverick spend, contract terms, or supplier risk.
-
Analyst dependency: Routine reporting depends on technical teams, slowing delivery.
-
Poor multi-source handling: Struggles with data from multiple ERPs or supplier systems.
-
Inconsistent classifications: No standard taxonomy enforcement across teams or reports.
-
Low self-service access: Non-technical users can't explore data independently.
Procurement Analytics Software
Dedicated procurement analytics platforms are specifically designed to handle procurement-related data, structures, and workflows. Instead of building reports from scratch, they offer pre-configured modules that connect, cleanse, and analyze procurement data automatically.
Procurement analytics involves discovering, interpreting, and communicating meaningful insights that inform strategic procurement decisions.
Example of Sievo procurement analytics software
Benefits of Procurement Analytics Software
-
Real-time data visibility: Automated updates ensure insights are always current.
-
Built-in procurement logic: Natively supports contract coverage, supplier diversity, ready-to-use procurement KPIs, and compliance metrics.
-
Handles complex data landscapes: Combines an unlimited number of ERPs, portals, and third-party sources with ease.
-
Reduces manual effort: Automates classification, cleansing, and enrichment at scale.
-
Scales across teams and regions: Designed for large procurement organizations.
-
Faster time to insight: Pre-configured dashboards accelerate setup.
-
Enables self-service and conversational analytics: Non-technical users can explore and act on insights directly.
-
Continuous product improvement: Vendors invest in procurement-specific R&D and best practices.
Read more the 7 benefits of Procurement Analytics.
Key Challenges of Procurement Analytics Software
- Total Cost of Ownership for SMEs: Advanced features and infrastructure come with a higher price tag. Realized savings outweigh the investment, but small and medium-sized enterprises (SMEs) with limited spend under management may take more time to break even.
- Limited Customization: Procurement platforms are optimized for domain-specific workflows, rather than providing blank-slate customization. However, tools like Sievo offer configurable dashboards and conversational analytics to make insights accessible without technical skills.
Three Steps of Procurement Analytics
Procurement analytics brings visibility into spend and supplier performance and helps un-tap potential savings and opportunities. Even though spend data already exists in systems, making sense of it is often far from straightforward.
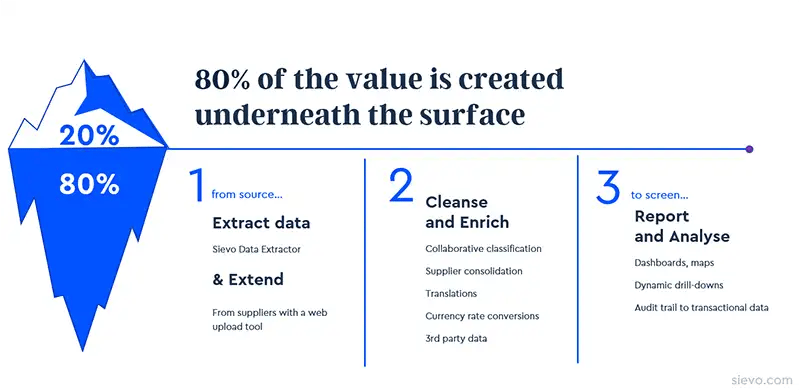
Here are the 3 general steps that take procurement data from source to screen.
1. Data Extraction
The process begins with collecting data from multiple internal and external sources, like ERPs, supplier systems, and finance tools, and consolidating it into a central environment.
For large enterprises, extraction is often the most resource-intensive step. Legacy systems aren’t built for heavy data pulls, making performance issues, downtime risks, and long lead times common, especially when pulling from dozens of sources without standard interfaces.
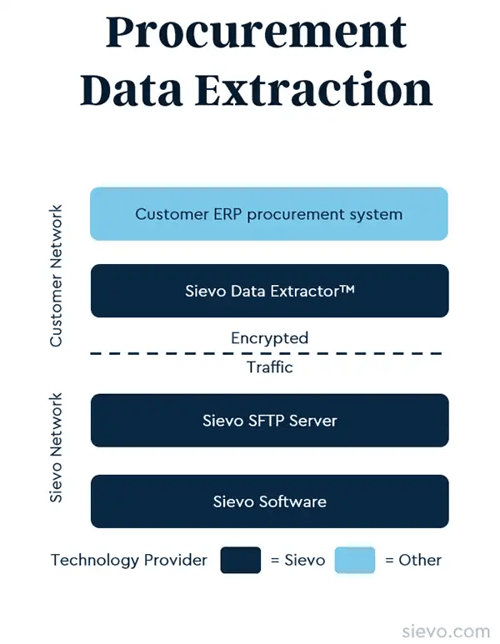
Sievo has built an automated data extractor capable of collecting data from over 100 different source systems. The Sievo Data Extractor is designed to connect and extract the most complex and extensive procurement data from various data sources, delivering it for further analytical processing.
Here are Sievo Data Extractor's five key strengths:
1. Speed through automation: Pre-configured templates streamline data pulls from multiple systems, reducing manual effort and resource dependency.
2. Data security: Extraction occurs within customer-controlled environments, ensuring sensitive data remains protected throughout the process.
3. Quick installation: Installs in minutes and supports broad compatibility across ERP, finance, and procurement systems without custom development.
4. Reliable monitoring: Built-in monitoring flags partial extracts or connection failures for timely intervention and recovery.
5. Data cleansing: Applies transformation logic during extraction to produce a clean, consolidated dataset ready for classification and analysis.
Read more about Sievo Data Extractor and other Integrations
2. Data cleansing, categorization, and enrichment
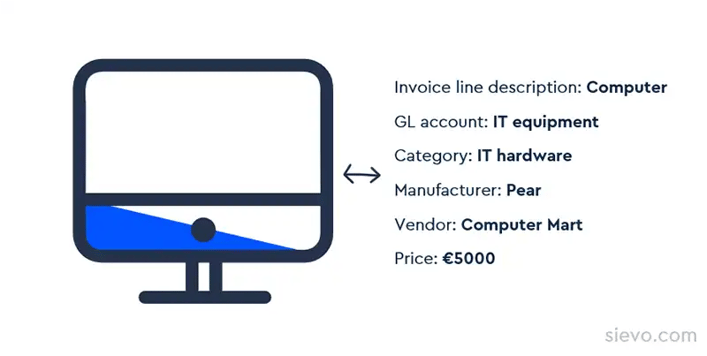
After extraction, raw spend data must be standardized, classified, and enriched to enable meaningful analysis. This step transforms fragmented inputs into a unified, structured view of procurement activity.
At its core, classification applies a consistent taxonomy to disparate transactions, aligning formats, naming conventions, and supplier identities. This harmonization enables accurate visibility across categories, regions, and business units.
Enrichment further enhances data quality through translation, supplier consolidation, and external attribute layering (e.g., risk scores, industry codes).
While complex, classification improves over time. Systems that combine expert logic with machine learning adapt to new data patterns and increase accuracy with scale.
Sievo's collaborative classification engine is not a black box, it is transparent. The visibility for customers makes the whole process collaborative, as the customers can freely participate and make exceptions if necessary. Once classified, the information is standardized across the organization, and users can see the data characteristics on which the classification is based.
Learn more about Sievo's process of classifying and enriching your data
3. Reporting and analysis
Once data is classified and enriched, it becomes analytically usable, ready to generate insights that inform sourcing, supplier management, and strategic planning.
Spend analysis is typically the first application. It quantifies procurement performance across cost, efficiency, and compliance dimensions and serves as the foundation for more advanced analytics.
Key outputs include:
-
Supplier segmentation by geography, risk, performance, and spend concentration
-
Category analysis to uncover trends, inefficiencies, or consolidation opportunities
-
Time-based comparisons for evaluating spend shifts across periods (e.g., YoY, QoQ)
At its best, reporting moves beyond static dashboards to enable source-to-screen analytics, a seamless pipeline from raw data to real-time insights. Most procurement value is buried beneath surface-level metrics; analytics brings it into view.
Evaluating Procurement Analytics Software
Each procurement organization has its method for evaluating and selecting new software partners. There is no silver bullet to finding the right partner, but these common best practices can help in the process:
-
Focus on insight enablement, not just data hygiene: Classification is foundational, but bottom-line impact comes from forecasting, benchmarking, and actionability.
-
Insist on end-to-end data transparency: Dashboards should support both executive overviews and transaction-level drilldowns without black-box logic.
-
Select vendors with domain expertise: Prioritize partners with deep procurement knowledge, proven references, and industry-specific implementation experience.
-
Involve cross-functional stakeholders early: Ensure alignment with Finance, IT, and Legal to support integration, governance, and long-term adoption.
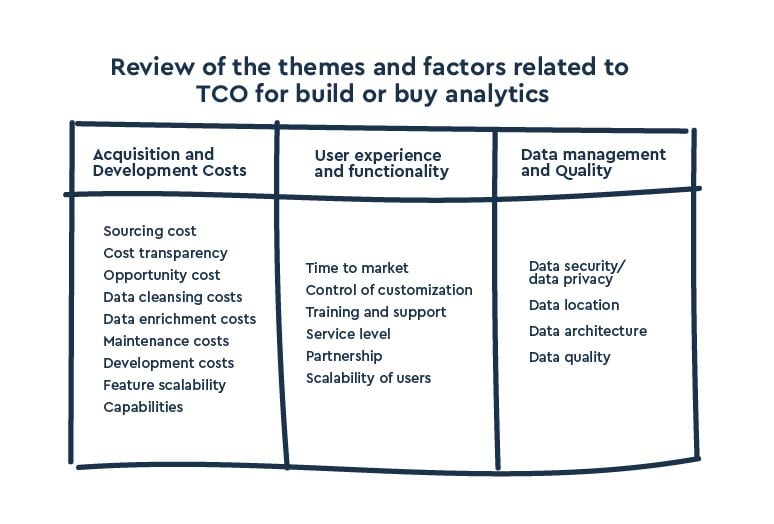
Procurement analytics platforms vary not only in features but also in the total resources they demand over time. A narrow focus on license fees often misses hidden operational costs. Total cost of ownership (TCO) provides a fuller picture by accounting for both upfront and ongoing investments across three key dimensions:
-
Acquisition & development: Costs tied to licensing, customization, maintenance, and the opportunity cost of internal development.
-
User enablement: Training, onboarding, change management, and the productivity impact of the adoption curve.
-
Data infrastructure: Long-term costs of managing integration, quality assurance, security, and governance.
Evaluating TCO ensures solutions are assessed not just by capabilities, but by their real-world operational fit.
Get a free RFP template for procurement analytics software
About Sievo
Sievo provides actionable procurement analytics based on data you can trust.
Designed for large enterprises with $1B+ in revenue, loved by global companies featuring Mars, Levi’s, and Deutsche Telekom, and praised by key analysts, we provide a future-proof solution with immediate ROI.
We empower Procurement, Finance, IT, and Sustainability teams to overcome their data chaos and capture all insights, drive bottom-line savings, improve ESG performance, and streamline budgeting and forecasting.
Sievo goes beyond world-class analytics and dashboards. We help our customers close the data-to-action gap with reliable insights, recommendations, and benchmarks by combining internal, third-party, and cross-customer data.
By processing spend data equivalent to 2% of the world's GDP annually, we enable fast, informed decision-making and deliver the industry's highest data quality with end-to-end data accountability.
Awarded and recognized by top analysts including Spend Matters, ProcureTech, and Procurement Leaders – we offer solutions for Spend Analytics, Procurement Performance Measurement, ESG Analytics, and Financial Planning and Analysis.
We call it procurement excellence - but you can call it Sievo.
Ready to see Procurement Analytics in action?
An eBook that inspires data-driven procurement
Gain practical advice on data-driven leadership and utilizing procurement data ecosystems with Procurement ❤️ Data. Get your copy: