Spend Analysis: A Short Introduction
Spend analysis is the practice of analyzing procurement spend to decrease costs, increase efficiency or improve supplier relationships.
Tell Me MoreUpdated: Nov 27, 2025
Spend analysis is the practice of analyzing procurement spend to decrease costs, increase efficiency or improve supplier relationships. Reports generated from the analyses provide recommendations based on facts, not assumptions.
Decisions can be made on how to effect changes and the strategic actions to take. This analysis guides category leaders and budget holders in maximizing value from third-party expenditure and supplier relationships.
This guide is a short introduction to spend analysis, but you can read much more in our comprehensive guide!
Why is it important?
Spend analysis converts raw data into usable information. They deliver insights into an organization's procurement activities and expenditures, uncovering opportunities to lower its overall cost to procure goods and services.
We typically embark on a spend analysis exercise to:
-
Identify areas of opportunity to reduce costs
-
Improve supplier performance and manage supply risk
-
Streamline sourcing processes for better efficiency
-
Identify out-of-contract or unauthorized spending
-
Leverage or consolidate similar products or services
-
Diversify the supplier database
-
Identify opportunities for more sustainable procurement
-
Create more accurate budgeting and spend forecasts
To deliver improved organizational performance, we need to collect, cleanse, classify and analyze the spend data in multiple ways to uncover and shed light on opportunities. Besides highlighting areas for cost savings and improved supplier performance, we can make better sourcing decisions, reduce cycle times and ensure contract compliance.
Spend analysis in Enterprise Spend management
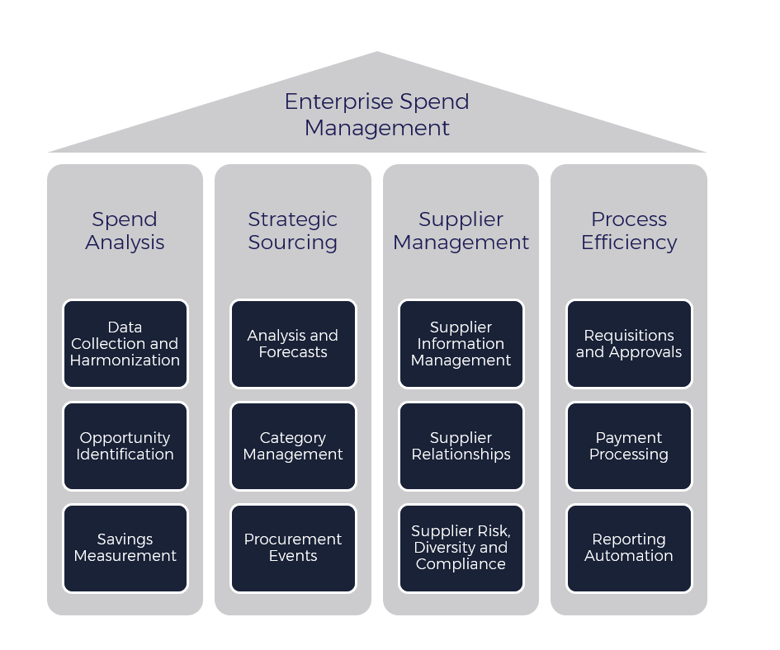
Spend analysis is one of the key levers that leading procurement organizations use to optimize their buying power. It is one of the four pillars of spend management along with strategic sourcing, supplier management, and procurement process efficiency improvement.
Spend analysis data, when categorized, cleansed, and summarized, provides spend visibility, i.e., the picture behind the numbers. Real-time management reports, in various levels of detail, provide insights that can result in better supplier relationships.
This information can also be used for forecasting cash flows, setting budgets, and re-aligning spend categories.
Do you have a clear picture of how money is moving out of your organization? Organizations with clear spend visibility drive better procurement performance and make more informed business decisions.
Benefits of Spend Analysis in Procurement
The benefits of analyzing spend can be summarized in 8 ways.
- Provides a window into spend patterns and buying trends across the whole enterprise.
- Delivers improved data quality and reliability through cleaning, validating, and enriching the data for fact-based decision-making.
- Creates opportunities for supplier consolidation and benchmarking. Economies of scale can be explored within sourcing categories.
- Promotes contract compliance and limits supplier risk. Spend analysis reduces the scope for invoice fraud and unauthorized and maverick spend by reporting on out-of-contract spend.
- Identifies procurement process challenges and highlights areas to improve efficiency such as shortening cycle times and removing redundant tasks.
- Provides input into the forecasting and budget process, giving direction for future strategic sourcing strategies.
- Increasingly used to establish an enterprise’s sustainability profile and impact. Results are used to set and track sustainability goals.
- Can track historical spend for fact-based realized savings reporting - against a pre-agreed baseline.
Sources of Procurement Spend Data
Most of the data you are looking for is held within your company’s financial records. The general ledger is a master account that provides a complete record of your business's financial transactions in detail.
It is usually managed using an enterprise-wide ERP system such as SAP or Oracle or within an in-house proprietary accounting system. Source documents include purchase orders, goods received and invoice documents, company credit cards and direct treasury payments.
The process of aggregating and validating the data takes time and patience. It is also not an event but rather a repeatable process ensuring that you always have the most up-to-date information. This may be the ideal time to implement a spend analysis software solution designed for this purpose.
Spend Analysis Examples: Slicing and Dicing the Data
At the highest level, spend data can be analyzed simply in many ways. For example:
-
Total expenditure by supplier
-
Total spend by category/commodity
-
Number of suppliers by commodity
-
Number of transactions by commodity
-
Spend value per business unit
-
Average spend value per employee
-
Average purchase order value
Spend-per supplier
If we aim to achieve a preferred spending pattern of 80% of our spend through 20% of our key suppliers, is this what the data is telling us? By understanding whom we are doing the most business with, we can focus on areas for cost savings through better contract negotiations and supplier rationalization. Where many suppliers are contributing to the remaining 20% of the spend, there may be an opportunity to consolidate.
Spend-per category
Establishing the pattern of supply for a given category of goods or services across geographical territories and locations can uncover opportunities for volume consolidation and improved performance.
Allocating spend into predefined categories and sub-categories (also called commodities) makes the data easier to navigate, interpret and understand. Focus on prioritizing the top spend categories to help identify and forecast savings opportunities. It is also an opportunity to gain a deeper understanding of a category.
- Are you buying similar goods and services from too many different suppliers?
- Are you buying high-value goods and services from suppliers with no contract?
Having access to detailed information on total spend by category aids resource allocation and helps teams prioritize activities that will deliver the highest return on investment for the level of effort required.
Spend per division/region/business unit/product
Companies with de-centralized procurement operations may have differing suppliers for the same commodities. Often different locations/departments will be buying the same product or item from other suppliers at different price points. There may be an opportunity for standardization, streamlining the supply, or taking advantage of global contracts. Conversely, the data can also create opportunities for local sourcing and diversity of supply.
Spend out-of-contract /unauthorized
By establishing the details of % compliance to contract we can better understand why off-contract purchases (also called maverick spend) are happening. There may be issues related to product quality, late delivery, or governance that need to be addressed.
Other cost savings can be achieved by analyzing payment terms. Total company spend summarized across different payment terms can deliver opportunities to renegotiate terms with high spend suppliers to improve cash flow.
Spend cubes
The spend cube is a unique way of taking a look at spend data, where the data is projected as a multidimensional cube. The three dimensions of the spend cube are Suppliers, Corporate business units, and Category of item. The dimensions could include subcategories of the different units across the organization, from suppliers, categories, and cost centers.

Our tips for starting your own spend analysis
Identify all sources of data
Start by identifying the areas of your business that purchase items, including procurement, finance, and marketing. Interrogate all financial systems for external payments. Supplement any gaps with information gained from suppliers.
Extract and categorize the data
Collect the data into one central database. Data is usually in different formats and currencies. This step may require a spend analysis tool to consolidate and present the data in a meaningful format.
Cleanse the data
Remove corrupt records and errors from the data. This includes eliminating discrepancies in descriptions, cleaning up definitions, and removing duplicate transactions.
Now analyze the data!
Spend analytics is about more than identifying potential cost savings. It helps procurement teams to demonstrate where they are adding value to stakeholders and supporting the goals of the enterprise. Managing large volumes of data from multiple sources and converting it into verified information is resource heavy and prone to error. Spend analysis software simplifies the process of converting raw data into information. Affordable, easy-to-use cloud-based solutions are available to deliver accurate and actionable reports quickly.
For more information, read our comprehensive guide Spend Analysis 101.
Frequently Asked Questions (FAQ)
What is spend analysis?
Spend analysis is the process of examining procurement data to find ways to reduce costs, improve efficiency, and enhance supplier relationships. It helps organizations make fact-based decisions by providing clear insights into spending patterns.
Why is spend analysis important for organizations?
It converts raw data into actionable information, revealing opportunities to save money and improve supplier performance. This insight helps organizations better manage procurement and make informed business decisions.
What are the main benefits of spend analysis in procurement?
Spend analysis offers benefits such as improved data quality, better contract compliance, supplier consolidation, and enhanced forecasting and budgeting. It also helps track sustainability goals and supports realized savings reporting.
Where does procurement spend data usually come from?
Procurement spend data is typically found in a company’s financial records, including the general ledger, ERP systems, purchase orders, invoices, and company credit card statements. This information is crucial for performing accurate spend analysis.
What are some examples of how spend data can be analyzed?
Spend data can be analyzed by supplier, category, business unit, region, and compliance to contract. Methods like the spend cube allow organizations to review spending from multiple perspectives, helping identify areas for improvement.
How should a company begin its own spend analysis?
Start by identifying all data sources across the business, then collect, categorize, and cleanse the data. Using spend analysis tools can help consolidate and present the information, making it easier to interpret and act upon.
What is a spend cube in procurement?
A spend cube is a multidimensional view of spend data that displays information by suppliers, business units, and item categories. This approach provides a deeper understanding of spending patterns across the organization.

Related Articles