How Spend Analytics Improves the Procure-to-Pay (P2P) Process: Maverick Spend, Supplier KPIs and Payment Optimization
The procure-to-pay process involves the whole purchasing cycle, from identifying needs, selecting vendors, keeping compliance, receiving, and paying. P2P analytics leverages data every step of the way.
Tell Me MoreUpdated: Feb 25, 2026
Integrated spend analytics across the procure-to-pay (P2P) cycle consolidates fragmented procurement data, surfaces approval bottlenecks, tracks supplier performance KPIs, identifies lost payment discounts, and detects fraud and maverick spending.
This article covers how spend analytics applies to each stage of the P2P process and the specific procurement risks that automated analytics can flag.
Handling large volumes of procurement data efficiently is time-consuming and labor-intensive, especially when sourced from multiple systems.
The P2P process creates a lot of procurement data, and also requires a lot of data to get right. What makes the process even more challenging is the many levels of authorization required within procurement and accounts payable to satisfy financial controls.
Automating the P2P cycle provides better process insight, fewer errors, and easier fraud detection.
Procurement data is produced during every step of the P2P process. Integrated P2P analytics can change the game in five key ways:
- Consolidation of P2P data across systems.
- Visibility into purchasing transactions in digestible dashboards.
- Bottleneck identification and process improvements.
- Risk identification and mitigation.
- The opportunity to optimize cash flow and budget expenditure more accurately
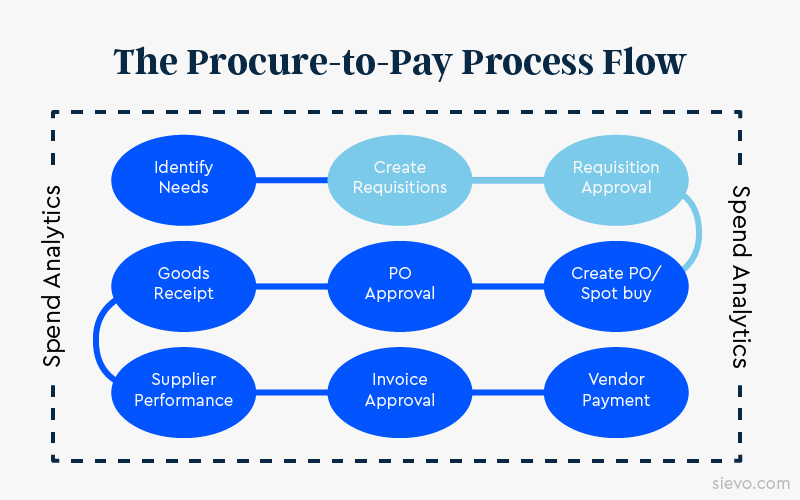
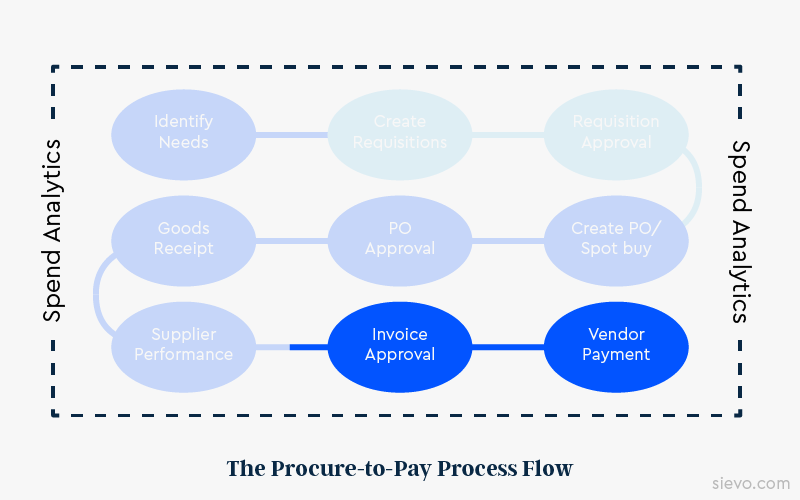
The Procure-to-Pay (P2P) Process
The procure-to-pay (P2P) process encompasses the entire purchasing cycle, from identifying needs and selecting vendors to ensuring compliance, receiving, and paying.
Note that some organizations have not implemented purchase requisition creation and approval within their P2P process. For some products or entire categories, the process may look different within the same organization.
The P2P process can become complicated as it cuts across multiple functions and involves many sub-processes and human interventions.
Procurement data is the byproduct of the P2P process. Data is generated every step of the way — in the PO process, in goods receipt, and in payment. Spend analytics ensures that data provides procurement teams with the insights needed to make strategic decisions.
The Benefits of Analytics in P2P
The biggest benefits of spend analytics in P2P are that processed data can be used to optimize operations and mitigate risks.
Payment terms, PO coverage, and contract terms should all be carefully analyzed to ensure optimal performance. An automated analytics solution provides a way to generate and present information at the category, process, contract, and item levels.
P2P analytics delivers insights that highlight inefficiencies and speed up decision-making. Analytics reveals bottlenecks and process pain points. Mitigating risk in P2P spans everything from reducing maverick spend to realizing full contract value. Fraud and non-compliance are more easily detected when relevant controls and approvals are in place.
SpendMatters reports organizations with stronger compliance frameworks achieved 91% adherence to sourcing strategy, compared to 74% among average performers. That 17-point compliance gap translated directly into reduced realized savings:
- 12% lower savings in IT and telecom
- 19% lower savings in HR services
- 20% lower savings in general supplies
Spend Analytics Across the P2P Cycle
The P2P process generates procurement data across fragmented systems, including ERP platforms, procurement tools, accounts payable software, and contract management databases. Without spend analytics, procurement teams lack a consolidated view of transactional activity.
Integrated P2P analytics addresses five operational gaps:
|
Operational Gap |
What P2P Analytics Provides |
|---|---|
|
Data fragmentation across systems |
Consolidated procurement data in a single analytical layer |
|
Limited transaction visibility |
Dashboards showing purchasing activity by category, supplier, and cost center |
|
Undetected process delays |
Bottleneck identification through cycle-time measurement at each approval stage |
|
Unquantified procurement risk |
Risk detection through spend classification and anomaly identification |
|
Inaccurate budget forecasting |
Cash flow and expenditure optimization based on actual payment behavior |
Each of these gaps represents a measurable cost to the organization, including delayed approvals, missed discounts, undetected fraud, and budget overruns.
Examples of Analytics in the P2P Process
Spend analytics plays a role at every step of the P2P cycle.
Analytics in Need Identification
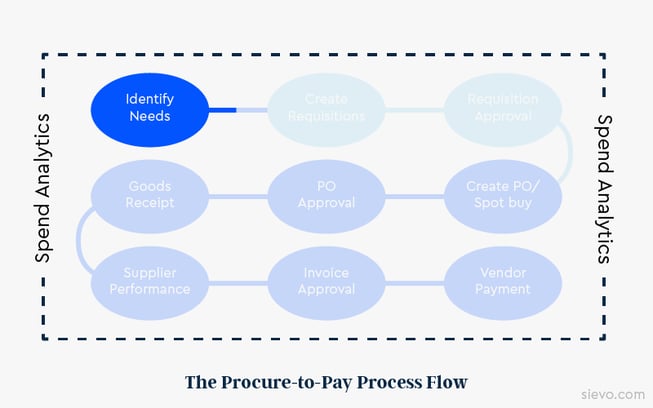
Spend analytics at the need identification stage answers three foundational procurement questions:
- Where is the organization buying? Supplier concentration and fragmentation analysis
- What is the organization buying? Category-level spend distribution
- Who is buying? Cost center and business unit spend attribution
These three dimensions form the spend cube. With that information, procurement teams can make informed decisions that support category goals and sourcing strategy.
Read all about Spend Cubes: what are they made up of?
Analytics in PO Approval
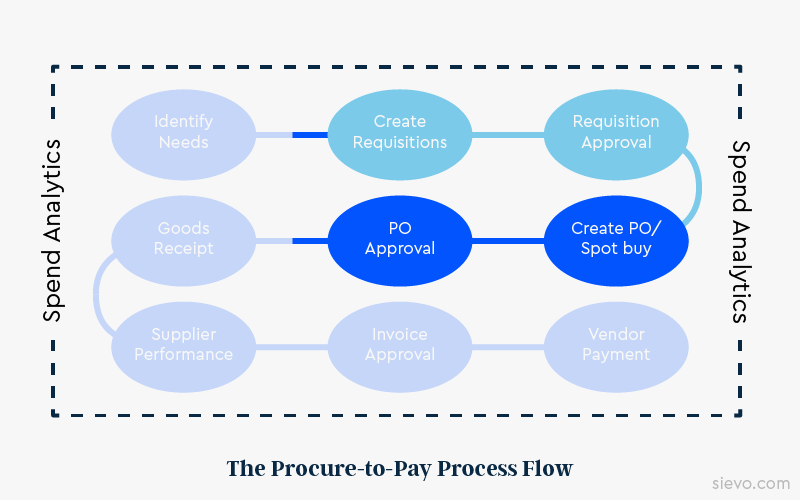
The time taken from purchase requisition (PR) approval to purchase order (PO) approval is a constant pain point for end users. When a business-critical project is moving forward, delays of weeks waiting for PO approval create real cost.
POs can be analyzed in many ways — volume per buyer, the average value of POs, ordering frequency, and POs by department — each of which shows how PO activities can be streamlined.
Analytics identifies the bottlenecks and helps procurement teams devise ways to speed them up. Accepted industry benchmarks can be used to compare cycle times and uncover the root causes of delays.
Analytics in Supplier Performance
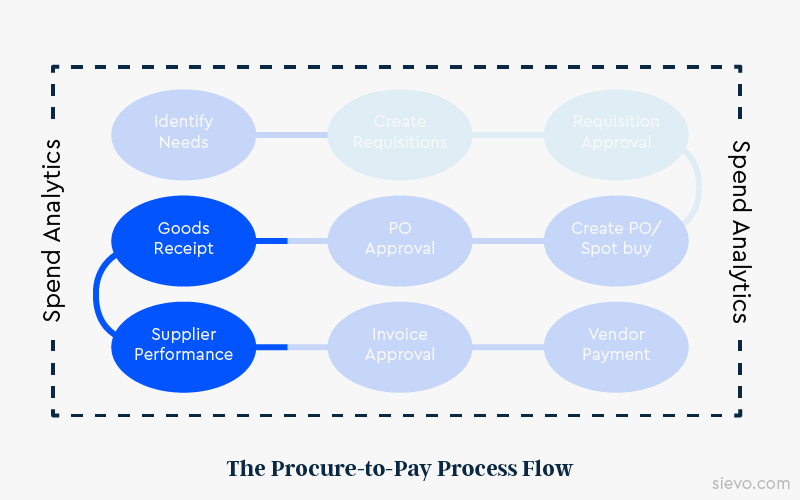
Supplier performance metrics are often documented or at least agreed upon verbally between buyer and supplier. With analytics integrated into the P2P process, procurement teams gain greater leverage and visibility over common KPIs:
|
Supplier Performance KPI |
What It Measures |
|---|---|
|
% of deliveries received in full |
Order completeness |
|
% of deliveries more than 10% late |
Delivery timeliness |
|
% of rejects or returns |
Quality compliance |
|
% of services delivered by the due date |
Service-level adherence |
More sophisticated measures include the frequency and timing of late deliveries. P2P analytics can answer questions like: "What was the number of days from order to receipt compared to the agreed delivery time?" and "How does this supplier compare to others in the same category?"
Analytics in Vendor Payment
Payment analytics provides multiple views into payments to suppliers, including early and late payment tracking. Whether 30 days late or 7 days early, all invoices impact cash flow and budgeting.
Early payment plans usually incorporate a benefit to the buyer. Payment analytics identifies where early-payment discounts have been lost.
Payment term spend analysis lets you explore opportunities for payment term optimization and savings and opens doors to renegotiation of contract terms.
Reducing Risk in the P2P Cycle
Beyond process optimization, spend analytics reduces procurement risk. Classifying spending by department, location, or end user can identify unauthorized purchases (maverick buying) and purchases outside the contract.
Every invoice coming from an unknown vendor should be analyzed. Has a supplier changed their name? Is it a maverick buy? Is it attempted fraud?
P2P Risk Areas Detectable Through Spend Analytics
|
Risk Area |
Description |
|---|---|
|
Orders with no contract |
PO issued without a linked supplier agreement |
|
Orders with no PR |
Purchase order created without prior requisition approval |
|
High-value orders with no approved PO |
Large expenditures bypassing PO controls |
|
One-time suppliers |
Vendors with a single transaction record |
|
Invoice with no matching PO |
Invoice received without a corresponding approved order |
|
Split PO to avoid higher-level approval |
Multiple POs below the threshold for what is functionally a single purchase |
|
Employees registered as suppliers |
Employee records matching supplier master data |
|
Suppliers that are friends or family of employees |
Supplier contact data matching employee networks |
|
Duplicate suppliers |
Multiple vendor master entries for the same legal entity |
|
Variations from contracted pricing |
Invoiced amounts that differ from agreed contract rates |
|
Payment without formal goods received documentation |
Invoice paid without confirmation of delivery |
The reasons for unauthorized purchases may be negligence, poor compliance, loose controls, or intentional fraud. No matter the reason, procurement teams are much more likely to spot errors with robust spend analytics in P2P.
Conclusions
Every stage of the P2P process, from need identification through vendor payment, produces data that can be turned into actionable insight. Integrated spend analytics gives procurement teams consolidated visibility across that data: where spend is going, how long approvals take, how suppliers are performing against agreed KPIs, and whether payment terms are being used to their full advantage.
On the risk side, automated spend classification can flag issues like maverick buying, split POs, duplicate suppliers, and pricing deviations that are easy to miss in manual reviews. The procurement organizations getting the most from their P2P data are the ones treating analytics not as a reporting layer, but as a core part of the process itself.
Related Articles