Thought Leadership
Spend Management - from Reporting to Forecasting

Sammeli Sammalkorpi • Jul 4, 2017
This article gives an overview of the paradigm shifts of spend management over the last couple of decades.
1. The starting point: spend analysis and contracted savings measurement.
Spend analysis is the basic building block of spend management, and no procurement organization can be run professionally without a good understanding of spend. Even though spend analysis has been around long, and will continue to do so, what can be achieved with spend analysis has changed drastically. We’ve seen a move from static, quarterly updated reports into drillable online analytical tools that are based on data that is updated weekly, if not daily.
Another old-time friend of spend management is contracted savings measurement. Even though procurement functions have, rightfully so, expanded their impact way beyond traditional savings chasing, savings measurement is here to stay. For me it’s just a license to operate – in the same way that all sales functions need to deliver closed deals, (almost) all procurement functions need to deliver savings. It’s not the only thing procurement needs to do, but it is one of the key aspects procurement needs to deliver.
In short, spend and contracted savings have been around for a long time and continue to do so. At the same time, these concepts have two fundamental limitations:
- They are backward-looking concepts
- They are procurement-oriented concepts
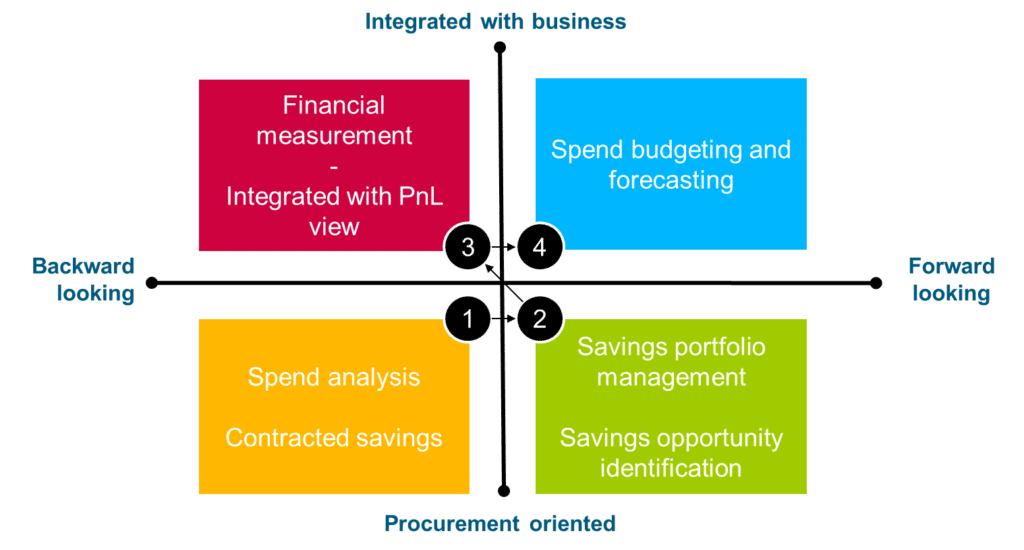
To understand how our clients, and spend management domain in general, have progressed beyond spend and contracted savings, it’s useful to look at the chart below.

2. Adopting a forward-looking view – savings portfolio management.
Natural next step beyond spend and savings measurement is to adopt a proactive approach to managing procurement performance. At this stage, spend analysis is still used, but not only as a high-level, static tool for creating sourcing strategies and designing category organizations.
At this stage, spend analysis is leveraged as a daily tool to identify savings and value creation opportunities. Instead of getting reports on “average payment days by categories”, the analytics platform proposes improvement actions such as “by harmonizing payment terms for supplier XYZ, you can free up 72 kEUR working capital”.
In addition to identifying opportunities, at this stage procurement organization constantly and proactively manages the savings opportunity portfolio. The CPO is less concerned about “how much savings was created last month”, and more concerned about “how much savings pipeline I have for the next 6 months”.
Obviously, savings actions should cover the full spectrum of value creation activities, such as price savings, policy changes, demand management, working capital, and supplier innovation. The good news is that transparency in the savings pipeline almost automatically also increases the pipeline. Transparency will drive idea sharing, positive competition, and learning across categories and regions.
3. Communicating in a way that business partners have a chance of understanding you.
Measuring contracted savings based on specific savings actions makes sense from a procurement point of view. However, this does not make sense from the perspective of the CFO and business. There are many reasons why measuring contracted savings based on savings actions just is not enough: contracted savings
- Are defined through categories – not through PnL accounts and cost centers. This means that the numbers do not have relevance to business stakeholders
- Are focused on procurement contribution and clear of commodity and currency impacts – which makes sense from a procurement contribution measurement point of view, but again, leads to limited business relevance
- Covers only part of overall spend that is actively managed – any changes on other parts of spend go unnoticed, and smart suppliers take advantage of this
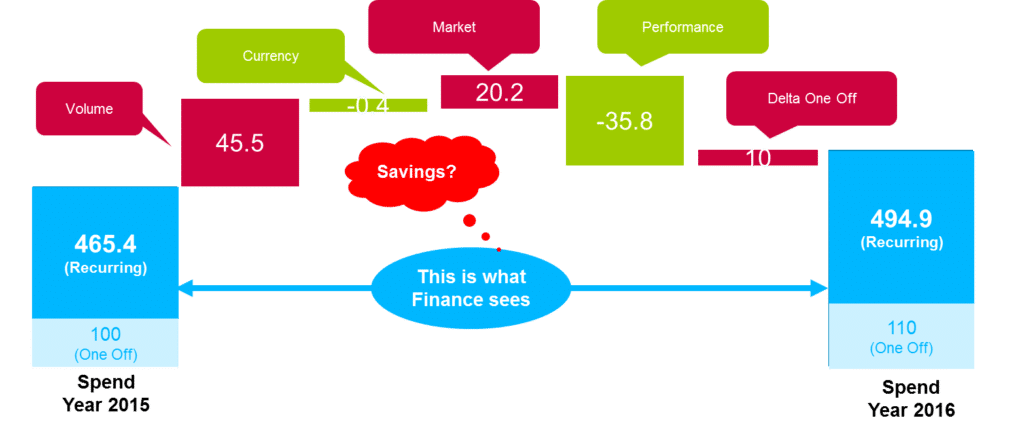
In short, procurement needs to get away from communicating “savings by category” to communicating “cost changes by cost centers / PnL accounts”. The key approach for doing this is to report spend and savings in an integrated way (and not in isolation). The picture below describes how this can be done.
Key is that we isolate (i) procurement contribution from (ii) total cost changes. Too often procurement and finance try to compromise on “what is saving”. The point is that no compromise would satisfy both parties, as “savings” is and will be fundamentally different from “cost change”.
Instead of creating a compromise, one should create two interrelated metrics – and both of these must be based on realized invoice data, not a bottom-up activity-based savings measurement exercise.

4. Creating a forward-looking view on cost changes.
Depending on your industry, procurement costs cover 30-70 % of total costs. As procurement costs tend to be much more volatile than other cost elements, procurement costs cover 60-95 % of total cost volatility.
With this fact, I find it amazing that very few companies have mastered creating a robust view of the impact that spend changes have on profitability. It’s not that businesses wouldn’t have recognized the need for it – they have, and most businesses try to navigate around this issue with a lot of Excel files and countless hours of controller work.
But, let’s face it, if Excel is not good enough for serious spend analysis, it’s not good enough for any professional forecasting, which is a much more complex and data-intensive process requiring many inputs from different stakeholders.
For us, the current best practice of spend management is the ability to create a forward-looking view on what’s going to happen to your profitability. Creating this forward-looking view requires that your forecasting process
- Provides procurement perspective (category, contributing savings action)
- Provides business perspective (cost center, business line, PnL account, end product)
- Is collaborative – collecting input from various stakeholders
- Is dynamic, allowing quick iterations when key assumptions (say, oil price) change
When procurement can switch the key message from “category savings” to “expected cost changes”, the interest and collaboration from business partners are guaranteed.
Open Positions
Welcome to explore our open job opportunities around the world
- Position
- Location
- Apply Before

