SIEVO STATE OF SPEND: 2027

Find out where your procurement performance really stands

The only procurement benchmark report built on real purchase orders, invoices, and supplier transactions, powered by Sievo Community Data.

Benchmark your organization against competitors in your sector, find out what that gap is worth in working capital and savings, and identify which categories to act on first.

How do you compare against top performers in your industry?

Payment Terms, PO coverage, supplier concentration and category spend, compared against real transaction data in your industry.
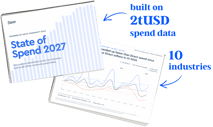
SoS27 mockup

Get my benchmarks

Trusted by

MDLZ Logo RGB
carlsberg-logo
Integrated_Service_Solutions_(logo).svg
T-mobile logo
schindler-logo
Coca-Cola_Femsa_Logo
hikma-logo
levi-strauss-co-logo
Mars logo
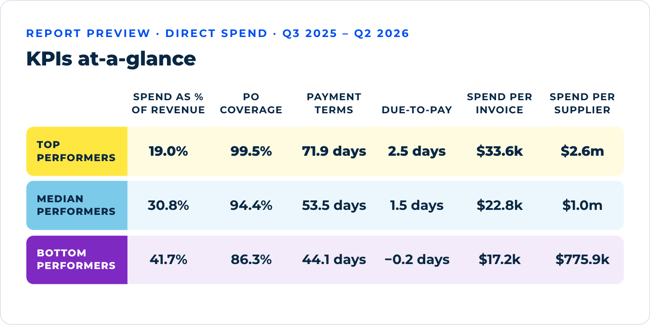
B · Clean KPI table · desktop 720@2x

BUILT ON SIEVO COMMUNITY DATA

Benchmarks from what companies actually paid, not what they reported in a survey.

2%+ of global GDP

in spend data processed
annually

11+ billion

transaction rows processed

9.5+ million

material codes across categories

100+ million

suppliers mapped and enriched

Ten industry editions

Choose your industry

Every edition is built only from companies in that sector, so the payment terms, supplier counts and category spend you compare yourself against belong to your real peers.

Get the Pharmaceuticals report

Change industry on the left. The report benchmarks pharmaceutical companies against the top performers in the sector.

Built from the procurement data from the world's leading enterprises. Unsubscribe at any time.

WHAT THE REPORT COVERS

Mind the gap…

Each benchmark shows the top, median and bottom performers in your industry, so you can tell whether a gap is a quick win or a structural one before you commit resources to it.

Top performersMedian performersBottom performers

Where do we stand against our peers?

Your invoice-to-due days, PO coverage, spend per supplier and supplier count next to the top, median and bottom performers in your industry.

What do companies like ours spend on?

Direct and Indirect spend broken down by category, so you can see where your mix differs from the sector's and why.

What are our payment terms costing us?

The working capital tied up in the gap between your terms and the top performers', category by category.

Where did spend move in 2026?

The category shifts that reshaped procurement budgets in your industry this year and what they signal for 2027 planning.

POWERED BY SIEVO COMMUNITY DATA

The reports show the pattern.

Sievo shows the savings lever.

Every benchmark in the State of Spend 2027 comes from real  transaction data. Inside Sievo, it’s linked automatically to your own spend, down to the individual materials and suppliers behind it.

Transactions are anonymized, cleansed and aggregated, so no company’s data can ever be identified.

See where you actually stand

Compare your payment terms, PO coverage and prices against peers in your industry, by category, country and supplier. You see your own position, not just the industry average.

Know where to negotiate first

Sievo Price Indexes are matched to the materials you buy, so you can see where your prices moved faster than your peers’ and which contracts to reopen first.

Turn payment terms into cash

Community Payment Terms flag the suppliers where your terms fall behind the peer benchmark, with a recommendation for each supplier and the working capital at stake.

11+ billion transaction rows

processed

100+ million suppliers

mapped and enriched by our classification engine

9.5+ million material codes

across categories

2% of global GDP

spend data equivalent processed annually
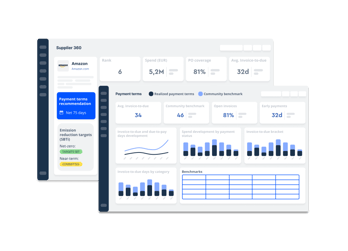
supplier 360 dashboard

Start saving with
Sievo Community Data

Inside Sievo, Community Data drills from industry-level peer benchmarks to your country, your suppliers, and your specific materials.


Learn more about Community Data
FAQ

How the benchmarks hold up

Why trust transactional benchmarks over a survey?

Every figure comes from purchase orders, invoices and supplier transactions processed by Sievo, so it reflects what companies actually paid and on what terms. Survey benchmarks depend on what respondents remember and are willing to disclose.

How relevant is the peer set to my company?

Each edition uses only companies in that industry, and every benchmark shows top, median and bottom performers rather than a single average, so you can see where you sit in the distribution instead of against a blended number.

Can I see these benchmarks against my own spend?

Yes. Sievo customers with Community Data see payment-term, price and supplier benchmarks against their own transactions inside the platform, with recommendations on where to act first. Book a demo to see what that looks like for your categories.


See how your industry's top performers buy, and how far you are from them.

Choose your industry and get the State of Spend 2027 report for your sector.