SIEVO STATE OF SPEND: 2027
Find out where your procurement performance really stands
The only procurement benchmark report built on real purchase orders, invoices, and supplier transactions, powered by Sievo Community Data.
Benchmark your organization against competitors in your sector, find out what that gap is worth in working capital and savings, and identify which categories to act on first.
How do you compare against top performers in your industry?
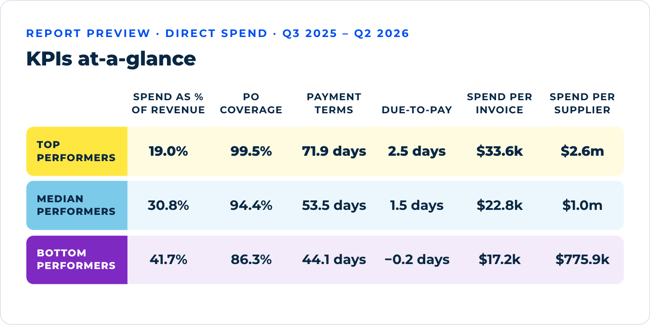
Payment Terms, PO coverage, supplier concentration and category spend, compared against real transaction data in your industry.
Trusted by


.svg.png?width=500&name=Integrated_Service_Solutions_(logo).svg.png)






BUILT ON SIEVO COMMUNITY DATA
Benchmarks from what companies actually paid, not what they reported in a survey.
2%+ of global GDP
in spend data processed
annually
11+ billion
transaction rows processed
9.5+ million
material codes across categories
100+ million
suppliers mapped and enriched
POWERED BY SIEVO COMMUNITY DATA
The reports show the pattern.
Sievo shows the savings lever.
Every benchmark in the State of Spend 2027 comes from real transaction data. Inside Sievo, it’s linked automatically to your own spend, down to the individual materials and suppliers behind it.
Transactions are anonymized, cleansed and aggregated, so no company’s data can ever be identified.
See where you actually stand
Compare your payment terms, PO coverage and prices against peers in your industry, by category, country and supplier. You see your own position, not just the industry average.
Know where to negotiate first
Sievo Price Indexes are matched to the materials you buy, so you can see where your prices moved faster than your peers’ and which contracts to reopen first.
Turn payment terms into cash
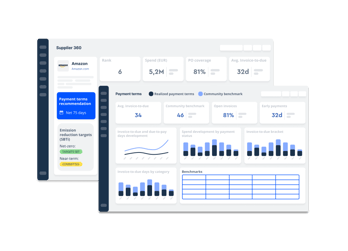
Community Payment Terms flag the suppliers where your terms fall behind the peer benchmark, with a recommendation for each supplier and the working capital at stake.
11+ billion transaction rows
processed
100+ million suppliers
mapped and enriched by our classification engine
9.5+ million material codes
across categories
2% of global GDP
spend data equivalent processed annually
Start saving with
Sievo Community Data
Inside Sievo, Community Data drills from industry-level peer benchmarks to your country, your suppliers, and your specific materials.